KPIs in eCommerce - how to effectively monitor your online store's performance?
Profits and sales volume are not the only numbers you should regularly track in your online store. To comprehensively assess the effectiveness of your activities and identify areas that need improvement, it is worth reaching for data that allows for deeper analysis. We are talking about key performance indicators, or KPIs. Thanks to them, you can not only monitor current results, but also set long-term goals and adjust your strategy to maximize the success of your eCommerce. In this article, we will look at what a KPI is, what are examples of KPIs in eCommerce, and how to calculate them correctly. We will also show how their regular analysis can contribute to the growth of your business. Read on!
Table of Contents:
- KPI – what is it?
- Key performance indicators – why use them?
- Key KPI indicators – examples for eCommerce
- Conversion rate
- Bounce rate
- Customer Acquisition Cost & Customer Lifetime Value
- How to calculate KPIs?
- Key performance indicators – how can they improve your e-store’s effectiveness?
KPI – what is it?
KPIs, or Key Performance Indicators, are simply a set of metrics that precisely show how well your online store is doing. KPIs are crucial for assessing the current condition of your eCommerce, and also serve as a reliable measure, enabling you to evaluate and compare business results month to month. Thanks to them, you can assess whether actions such as marketing campaigns or sales activities are effectively achieving set goals, such as increasing sales or boosting customer loyalty. KPI analysis also helps predict future sales trends.
Achieving all these effects is possible because KPIs focus on measurable values. This means they are not based on subjective opinions or feelings, but on specific data that can be verified, analyzed, and observed over time.
Additionally, analyzing KPIs gives great flexibility. This allows you to measure results in short intervals (e.g., checking the effectiveness of marketing activities in individual quarters), as well as set long-term goals for the future based on observed trends and tendencies. For both large companies and smaller businesses, regular KPI monitoring allows for more conscious and effective business management, which translates into better results and greater operational efficiency.
Key performance indicators – why use them?
“What gets measured gets managed, and what doesn’t get measured doesn’t get managed” – this is a frequently quoted phrase in the context of effective business management. It highlights the main benefit of using KPIs in business, namely monitoring the effectiveness of actions. KPIs allow you to track progress towards goals and identify areas that need improvement. For example, an increase in the abandoned cart rate (number of completed orders / number of all created carts x 100) may indicate shortcomings in the checkout process, such as complicated forms. This allows you to quickly respond to problems and optimize actions to achieve better results.
KPIs help to:
- Support making the right decisions – KPIs provide objective data that help assess the effectiveness of various actions and strategies, enabling better decision-making based on facts, not intuition.
- Help plan actions better – regular KPI monitoring allows you to predict trends and plan future actions with greater precision, leading to more effective resource and process management.
- Reduce information overload – with a well-chosen set of KPIs, you can focus on the key aspects of your business, allowing managers and teams to concentrate on the most important success metrics instead of getting lost in a sea of data.
- Identify areas that need improvement – monitoring metrics allows you to notice which processes are not working optimally (e.g., the returns process) or which strategies are not delivering expected results. This enables quick responses to weak points or shortcomings and the implementation of improvements.
Key KPI indicators – examples for eCommerce
KPIs can help grow your business, but only if they are properly tailored to its specifics. It’s important to remember one thing: there is no universal set of KPIs for eCommerce. Every e-store has a unique set of features and faces different challenges, so it’s crucial to define individual metrics that will allow you to effectively measure progress. KPIs should be selected depending on your goals and the type and intensity of your strategies. Before effectively measuring KPIs, it’s useful to analyze your traffic sources. Users can reach your store in various ways – organically (by entering a query in a search engine), via paid ads, or, for example, by finding your store’s profile on social media. Understanding where your traffic comes from helps you invest more effectively in channels that bring better results.
However, there are some universal metrics that will work for the vast majority of businesses. Below you’ll find a brief overview of the most popular KPIs used by eCommerce professionals.
Conversion rate
Conversion rate indicates the percentage of users who perform desired actions compared to all visitors. For online stores, this action is most often making a purchase, but it can also be, for example, signing up for a newsletter or downloading the store’s app.
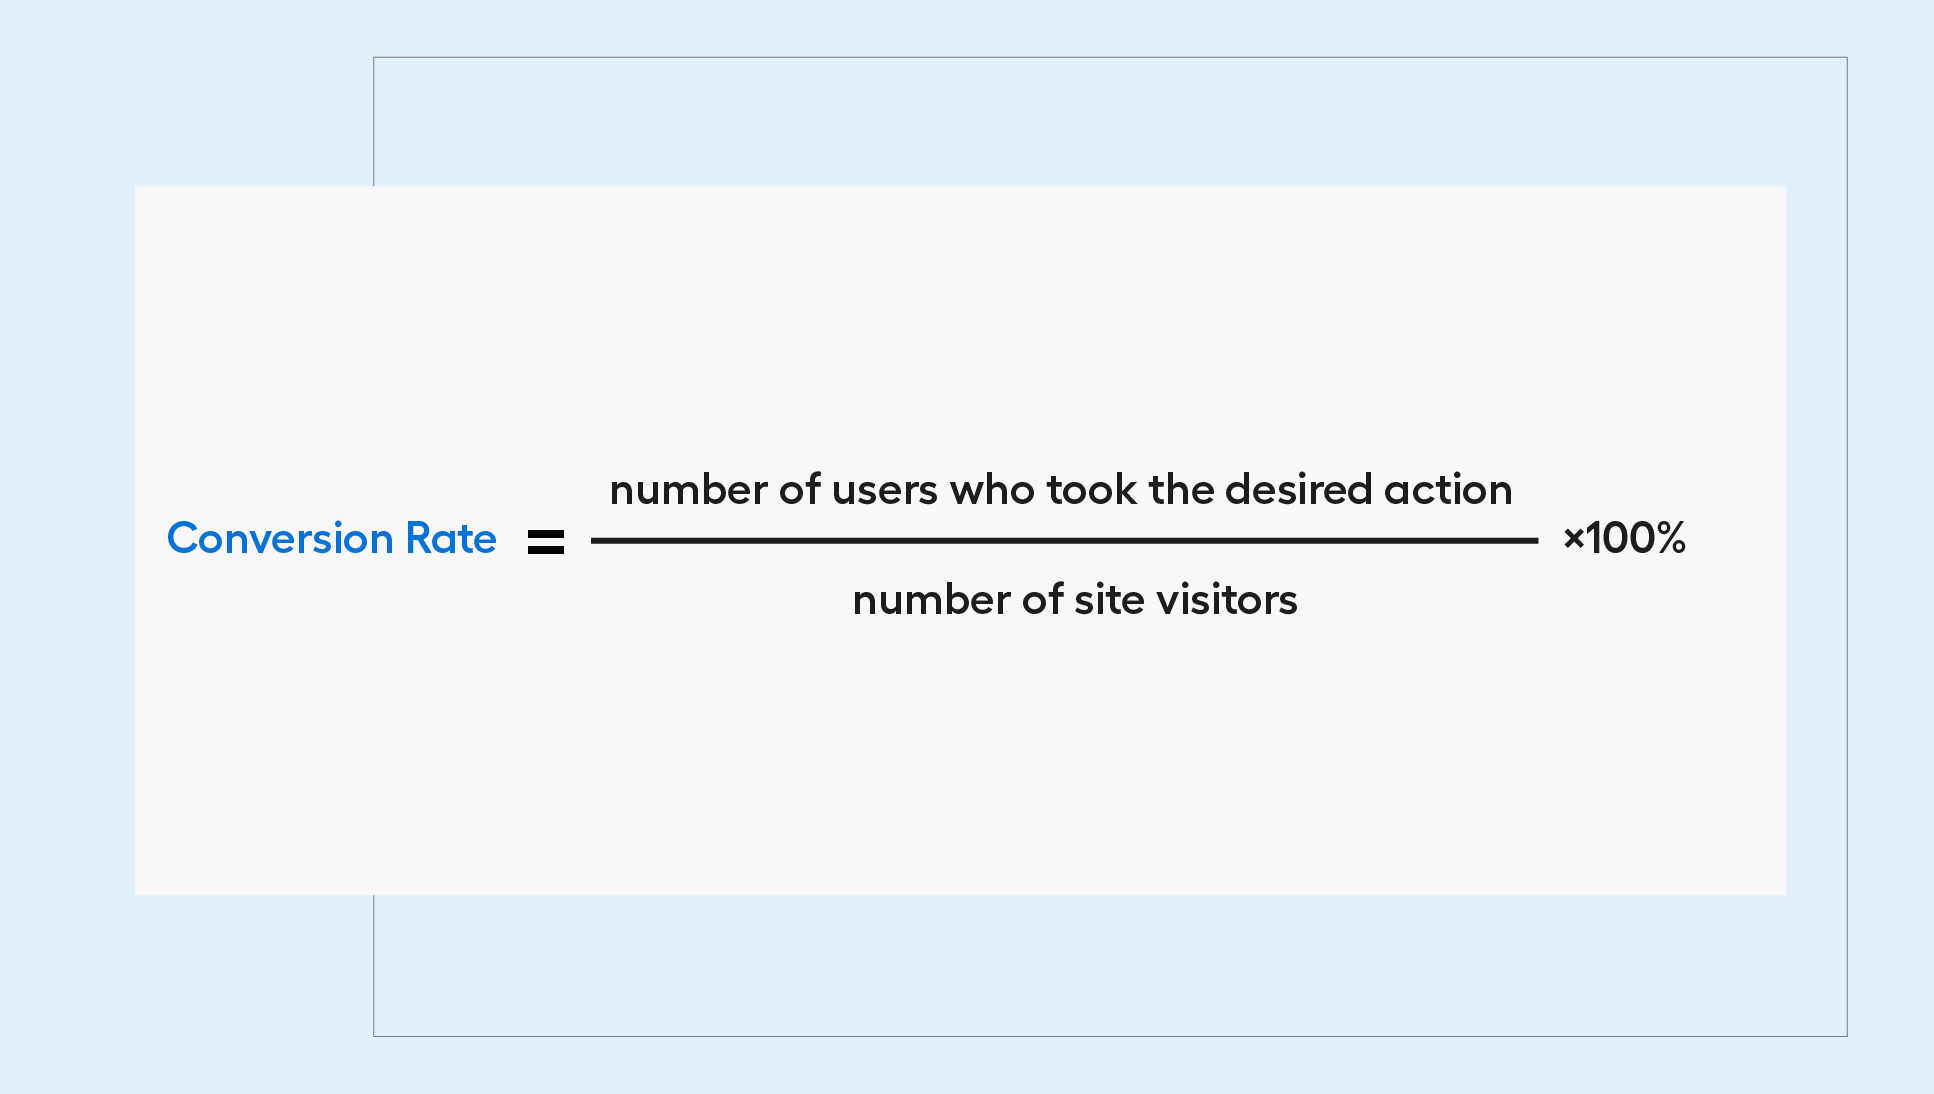
It’s always worth monitoring the conversion rate. Why? Because it shows what percentage of visitors “turn into” actual customers. A high conversion rate indicates the effectiveness of your site and offer. It’s also a sign that your advertising activities are reaching the right group. Lower values, on the other hand, may signal problems – with the product offer itself or the user experience on the site. If, for example, your product’s price and quality remain competitive, it’s worth considering potential errors on the site.
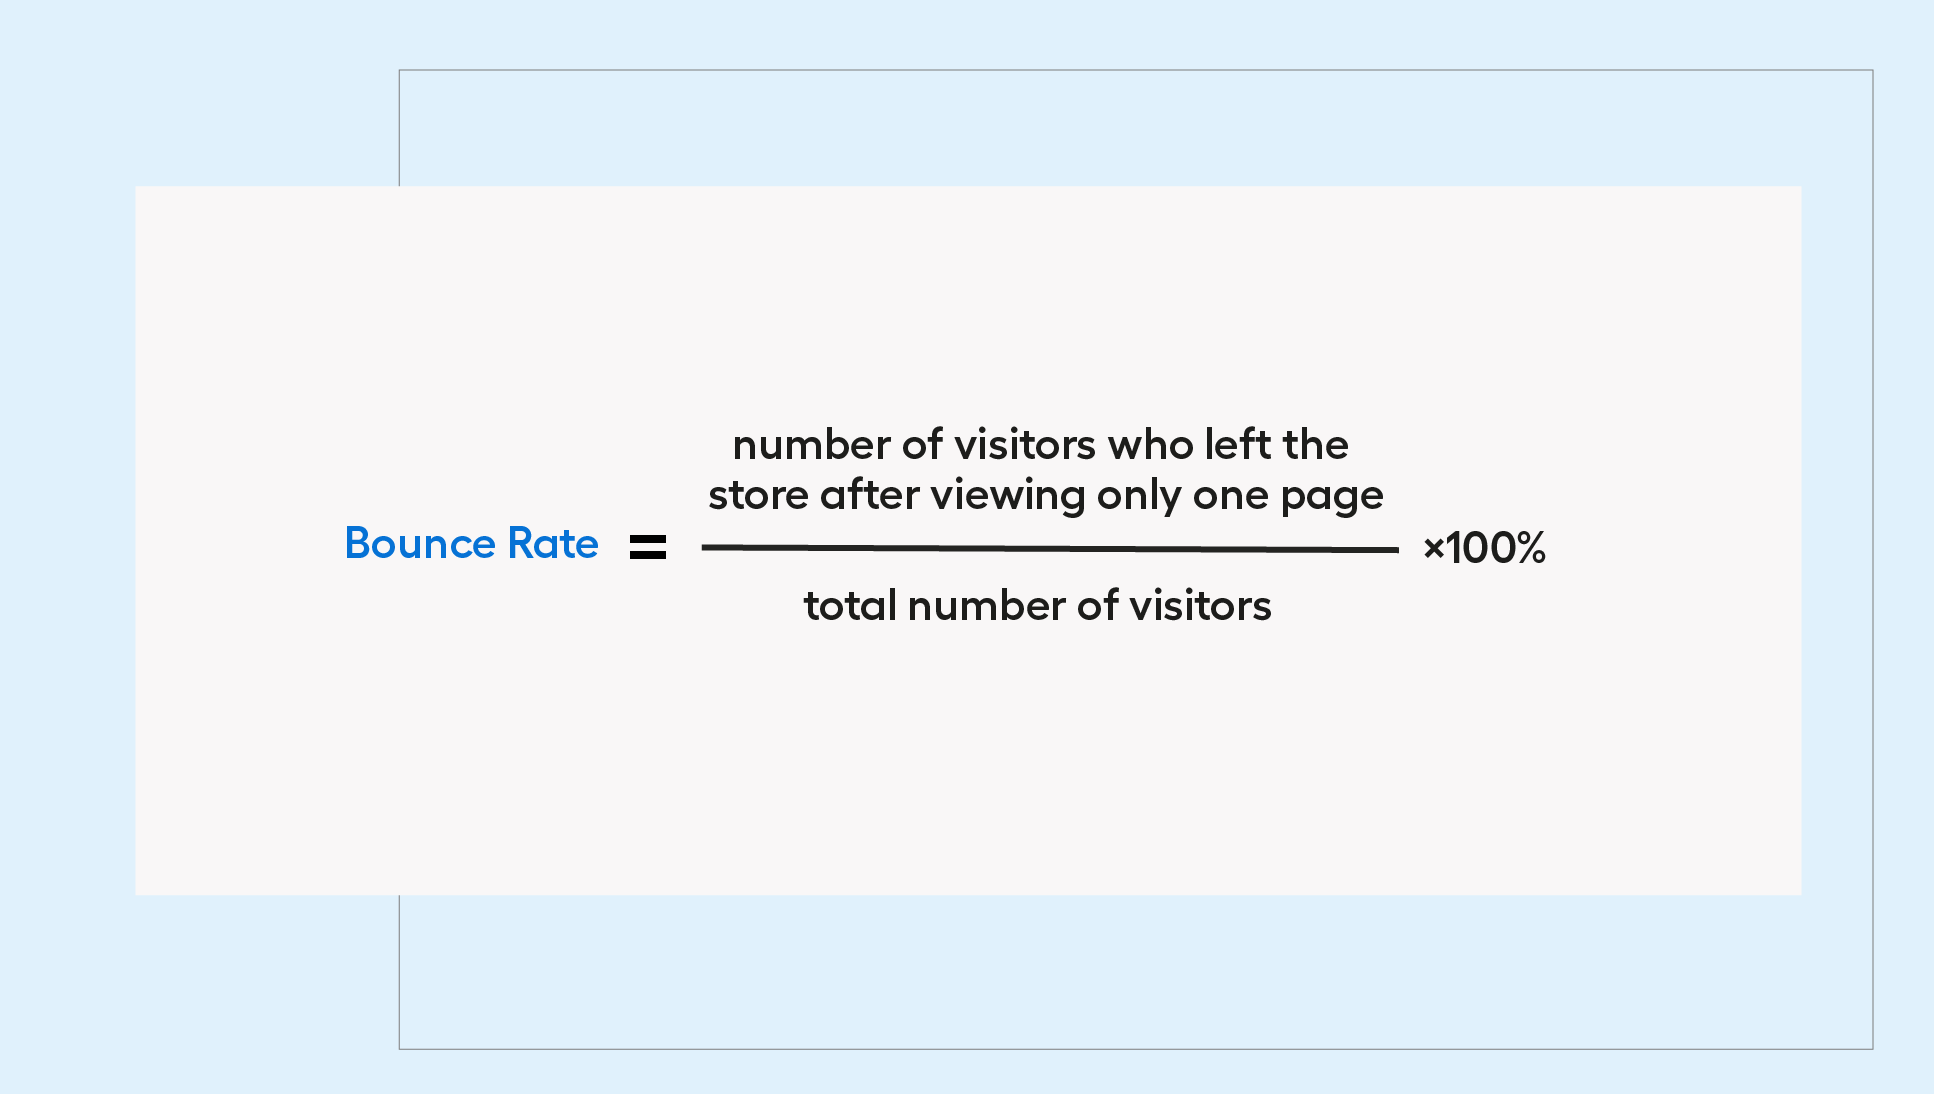
Bounce rate
The percentage of visitors who leave the site without taking any action (e.g., clicking a button, filling out a form, etc.), i.e., the bounce rate, is another metric that may suggest your site does not meet user expectations. The reluctance to stay on the site may result from several factors. Most often these are:
- lack of intuitive navigation,
- inadequate content matching user expectations,
- long page load times,
- errors in ad campaign settings attracting the wrong users,
- or simply – clicking an incorrect link or giving up browsing the site.
There are many reasons for an increased bounce rate, so remember to analyze results regularly, making gradual changes to the site. If you notice the bounce rate drops after modifications, it’s a sign your actions are having a positive effect.
Customer Acquisition Cost & Customer Lifetime Value
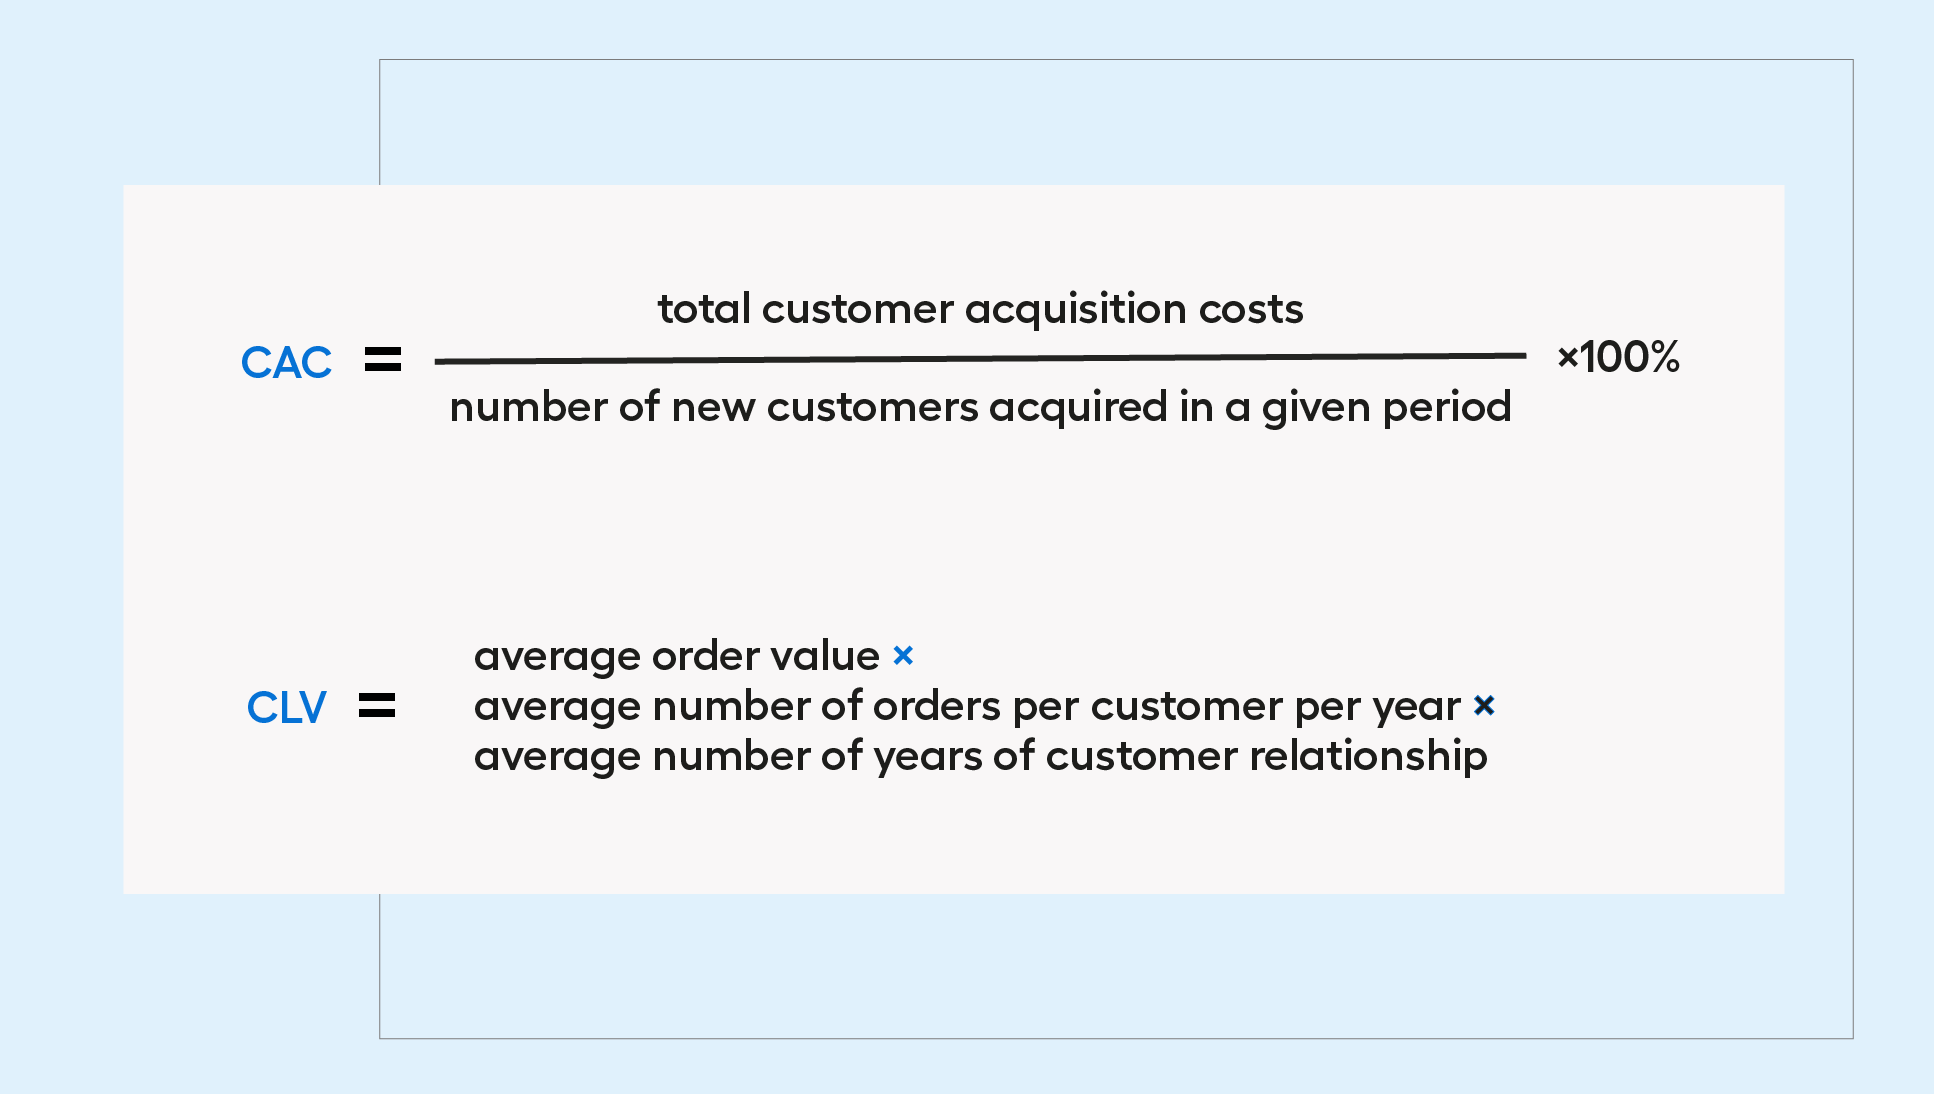
Customer Acquisition Cost (CAC) and Customer Lifetime Value (CLV) are two metrics worth tracking together. Combining these two KPIs will be especially valuable for industries that pay great attention to maintaining customer loyalty and take action in this area.
CAC allows you to assess the effectiveness of marketing activities and whether customer acquisition costs are adequate to generated revenue. CLV measures how effective these activities are in the long term. A high CLV indicates the company effectively retains customers and their trust, e.g., through effective promotions, loyalty programs, or up-selling and cross-selling strategies.
Analyzing CAC and CLV together provides a complete picture of customer relationships, which is key to sustainable growth and long-term profitability.
Rate of return
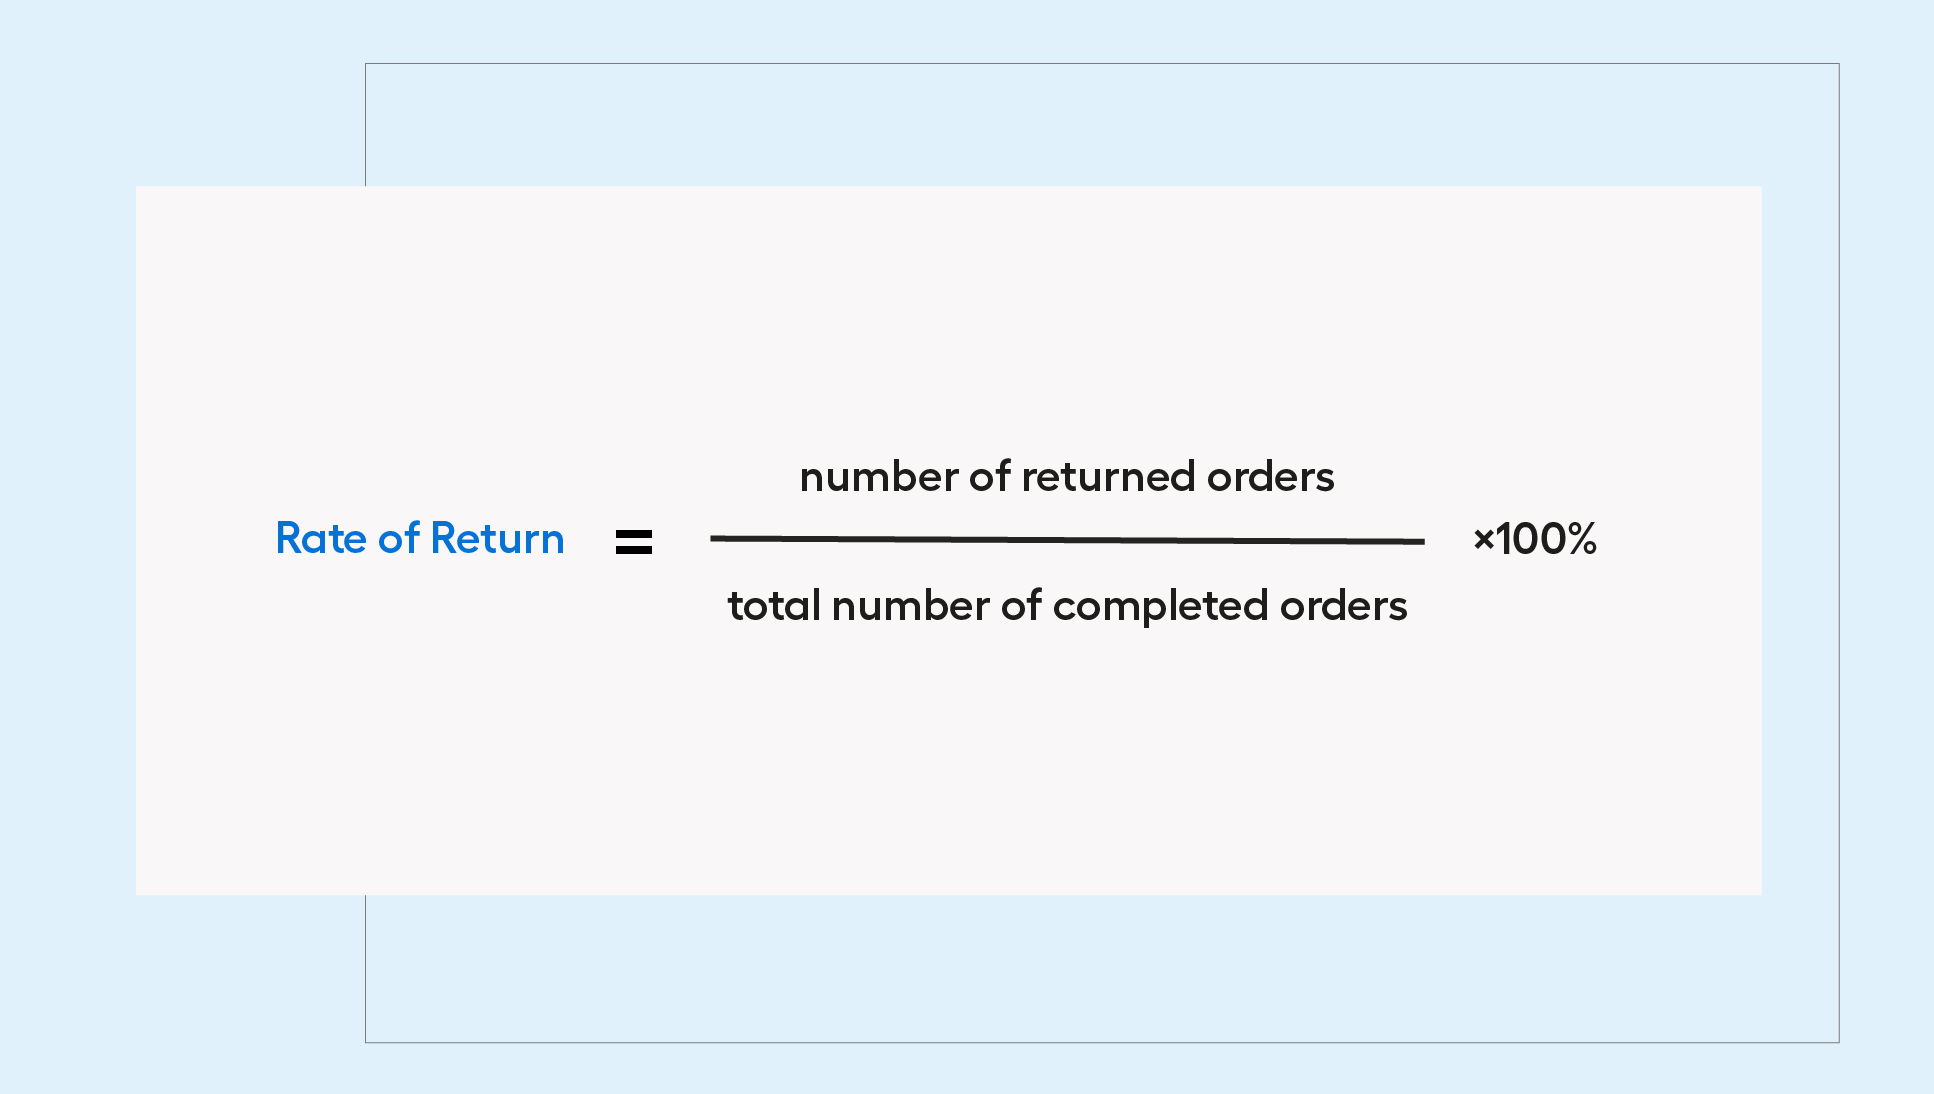
Rate of Return (RoR) is an efficiency metric that shows the percentage of returned orders. This is an important KPI in eCommerce – a high rate of return may signal that customers are dissatisfied with the products for various reasons. This may be due to low product quality or improper product presentation on the site. Inaccurate descriptions, poor photos, or lack of detailed information can lead to discrepancies between customer expectations and the reality of received products, resulting in a high RoR.
Optimizing the RoR not only minimizes costs associated with returns, but also builds customer trust and loyalty. Satisfied customers are more likely to make repeat purchases and recommend the store to others, which in the long run translates into increased revenue and improved financial results.
Remember, the list of KPIs is long, and some may be more suitable for your business’s specific needs. That’s why it’s important to continually expand your knowledge of KPIs and adapt them to changing market conditions and company strategy.
To delve deeper into KPIs and learn more about individual metrics, we invite you to read the “Numbers First” article series, where we discuss 15 eCommerce KPIs in detail, providing practical tips on how to interpret and use them to optimize your e-store’s activities. You’ll find the series below, including descriptions of such metrics as:
- Abandoned cart rate, average order value
- Mobile traffic research, return on investment
- Repeat purchase rate, sales growth rate
How to calculate KPIs?
Have you already chosen the set of KPIs for your eCommerce that you want to monitor? That’s basically only half the battle. Measuring key performance indicators, apart from being done regularly, should also meet certain criteria to provide valuable information. Below you’ll find some practical tips on how to calculate KPIs and how to monitor them correctly.
First, the adopted metrics should be simple to calculate and understand. Overly complicated metrics can make analysis difficult and cause confusion. The most commonly used KPIs are based on comparing two values, which allows for clear and specific conclusions.
Also, remember about data timeliness. Outdated information can lead to incorrect conclusions and poor business decisions. Regularly updating data is key to ensuring the information you analyze is reliable and reflects the real situation.
What else? Prepare the right environment for data analysis – organized and readable values will streamline working with metrics. Depending on your preferences, choose your set of tools. You can create reports in Google Analytics, Looker Studio, or compile data in Excel. It’s important that these tools are easy to use and allow for quick data interpretation. This way, you’ll be able to effectively monitor KPIs, identify trends, and make informed decisions based on reliable data.
Finally – regularly compare results with each other. Trend analysis and comparing metrics over different periods help you notice changes and identify areas for improvement. Comparing results allows you to spot long-term trends and better plan future actions. Systematic comparisons help identify effective strategies and those that need modification.
In summary, effective KPI monitoring requires regularity, simplicity, timeliness, objectivity, appropriate tools, and systematic result comparison. Following these principles will allow for better business management and achieving better results.
Key performance indicators – how can they improve your e-store’s effectiveness?
Is it really worth spending time every month calculating and analyzing KPIs? Yes, as long as you have a plan and strategy – that is, you know what a KPI is, which elements and why you want to measure. Key performance indicators not only allow you to assess the current situation but also to identify areas for improvement and set long-term goals.
Remember, however, that KPI analysis is a continuous process. It’s not enough to do it once and wait for results. That’s why you should regularly monitor your metrics, analyze trends, and draw conclusions. This way, you’ll be able to respond to changes on an ongoing basis and optimize your actions to achieve your set goals.