The efforts you are putting into running your online store are not bringing the expected results? Have you noticed a sudden improvement in sales performance, but can't diagnose its cause? Or are you skipping performance rate analysis in your business management strategy? No matter which of the above scenarios best describes your situation - an in-depth analysis of the data is crucial to assess the effectiveness of your operations and ensure that your sales platform is functioning properly in the future. Learn about the 5 key metrics in eCommerce by reading this article, which marks the beginning of a series dedicated to this topic.
Numbers don't lie - where to start analyzing rates in eCommerce?
Numbers don't lie - where to start analyzing rates in eCommerce? Numbers, percentages, ratios - in the multitude of various data, it is easy to miss the most relevant ones or make a mistake when analyzing them. The basic tool for observing the effectiveness of operations and traffic generated inside the site is Google Analytics, with the help of which it is possible to obtain information on key parameters from the perspective of eCommerce. What information will best illustrate the condition of your sales platform?
1. Conversion rate
Conversion rate is an essential element during the planning of an online marketing strategy. Why is it also important from an eCommerce point of view? The rate tells you what percentage of customers accessing the site complete a specific goal - in the case of an online store, this will usually be placing an order.
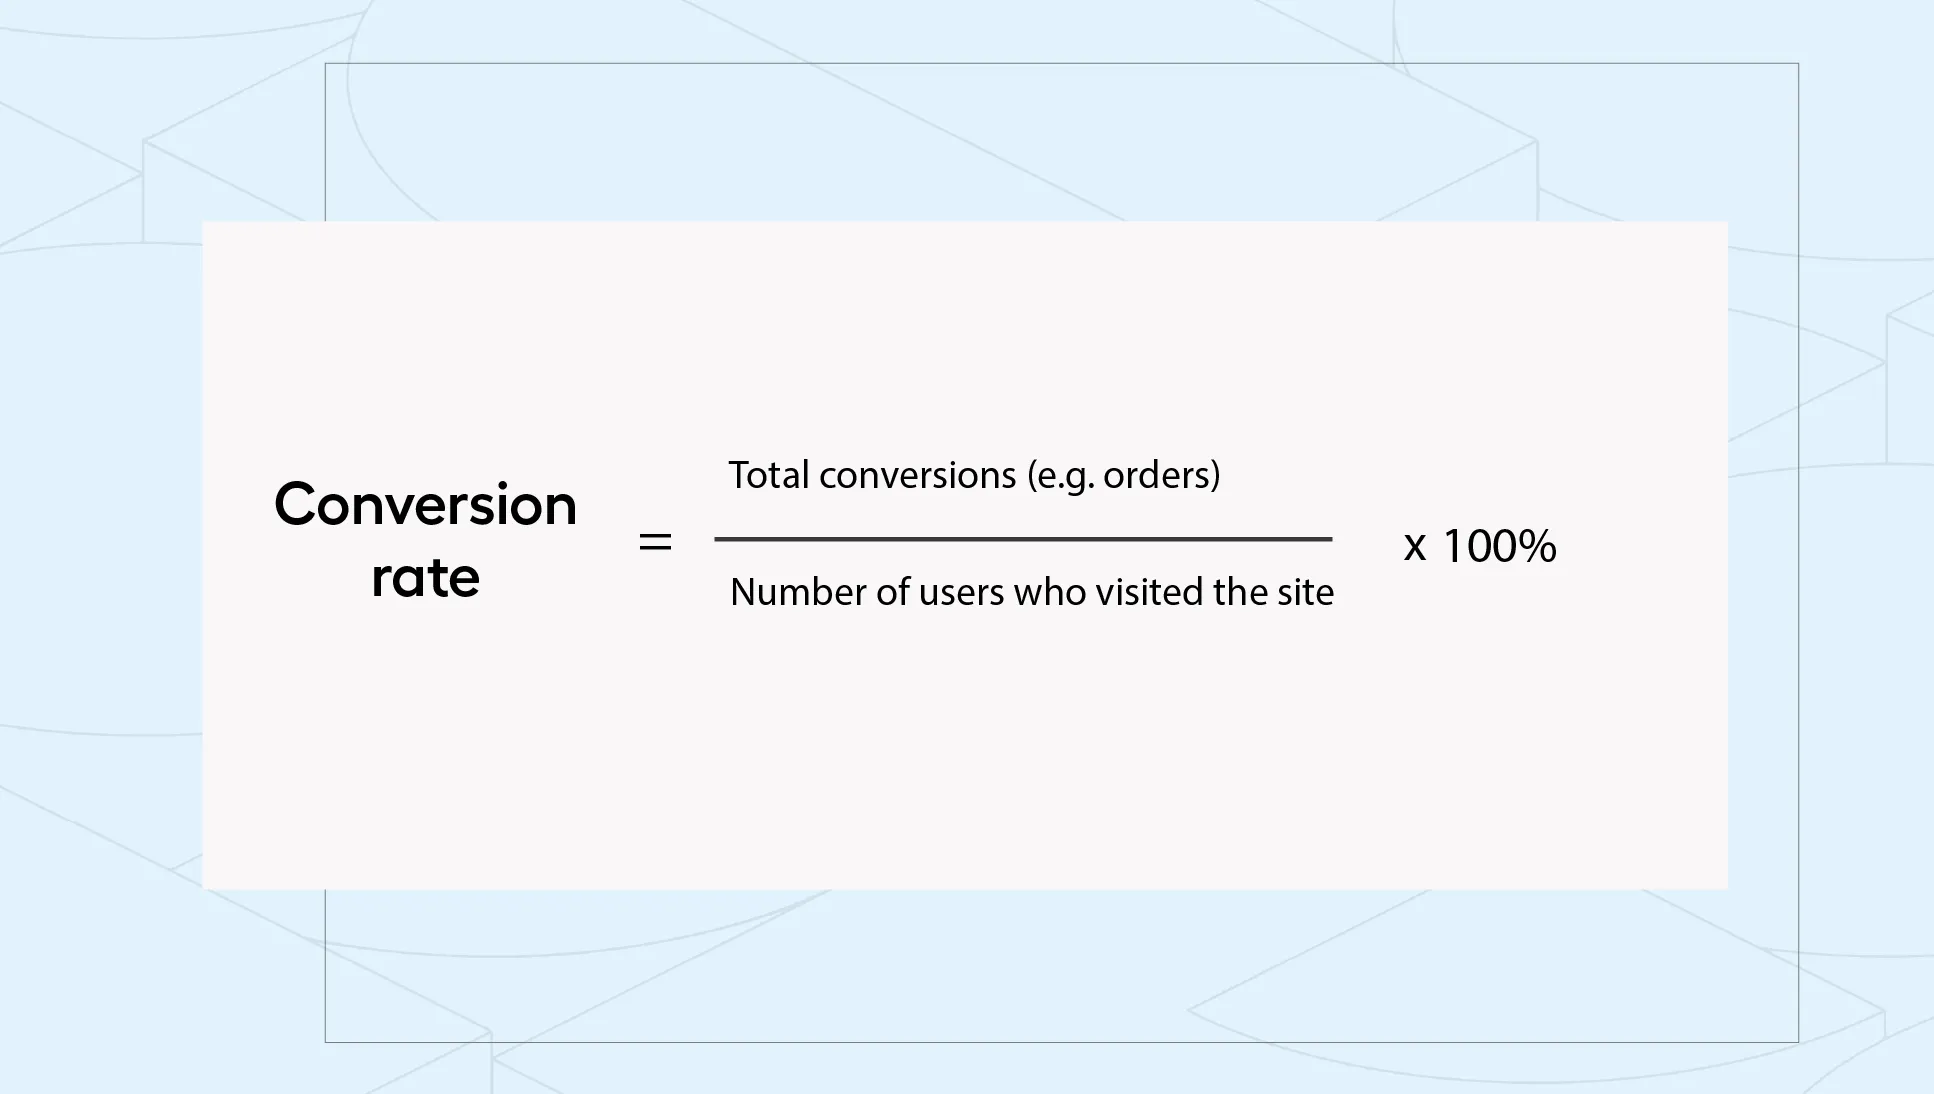
What result can be considered satisfactory? According to data from the Digital Experience Benchmark 2022 report, the average eCommerce conversion rate is between 2.5 and 3%. At the same time, only 25% of companies achieve results of 5%. However, when interpreting the results obtained, it should be borne in mind that the value of the rate may vary depending on the industry, sales channels or the type of devices used by users. Therefore, the data received should be evaluated based on individual business characteristics. In addition, a better representation of reality guarantees the distinction of conversions for individual marketing campaigns. Regardless of their type - you should always aim to increase results - how to achieve it?
- Shortening the shopping path - a multi-step process of finalizing an order, having to switch between cards to pay, or a form that is too long can cause your potential customer to abandon the purchase.
- Tailoring the content to the viewer - when communicating with customers, avoid distracting content. Unnecessary links or an excessive number of pop-ups can distract the customer from the main purpose of visiting the store, i.e. shopping.
- Page loading speed - according to statistics, as many as 40% of people will leave a website when it takes more than 3 seconds to load. There can be many reasons for extended waiting times, including: the need to change the server, inadequate use of plug-ins, unoptimized source code or poorly formatted graphics on the site.
2. Customer Lifetime Value (CLV)
One of the biggest challenges awaiting eCommerce owners is acquiring a new customers. For this reason, it is equally important to develop the conditions that will allow to take care of long-term relationships with buyers, and thus to make full use of the invested funds over time. Effectiveness in this aspect allows to estimate the CLV (Customer Lifetime Value).
Customer Lifetime Value is an index with the help of which it is possible to calculate the average value (profit) that a consumer generates for a given business over the entire duration of the relationship. CLV allows to assess the level of loyalty. There are a couple of ways to calculate this number - one of them is presented below.
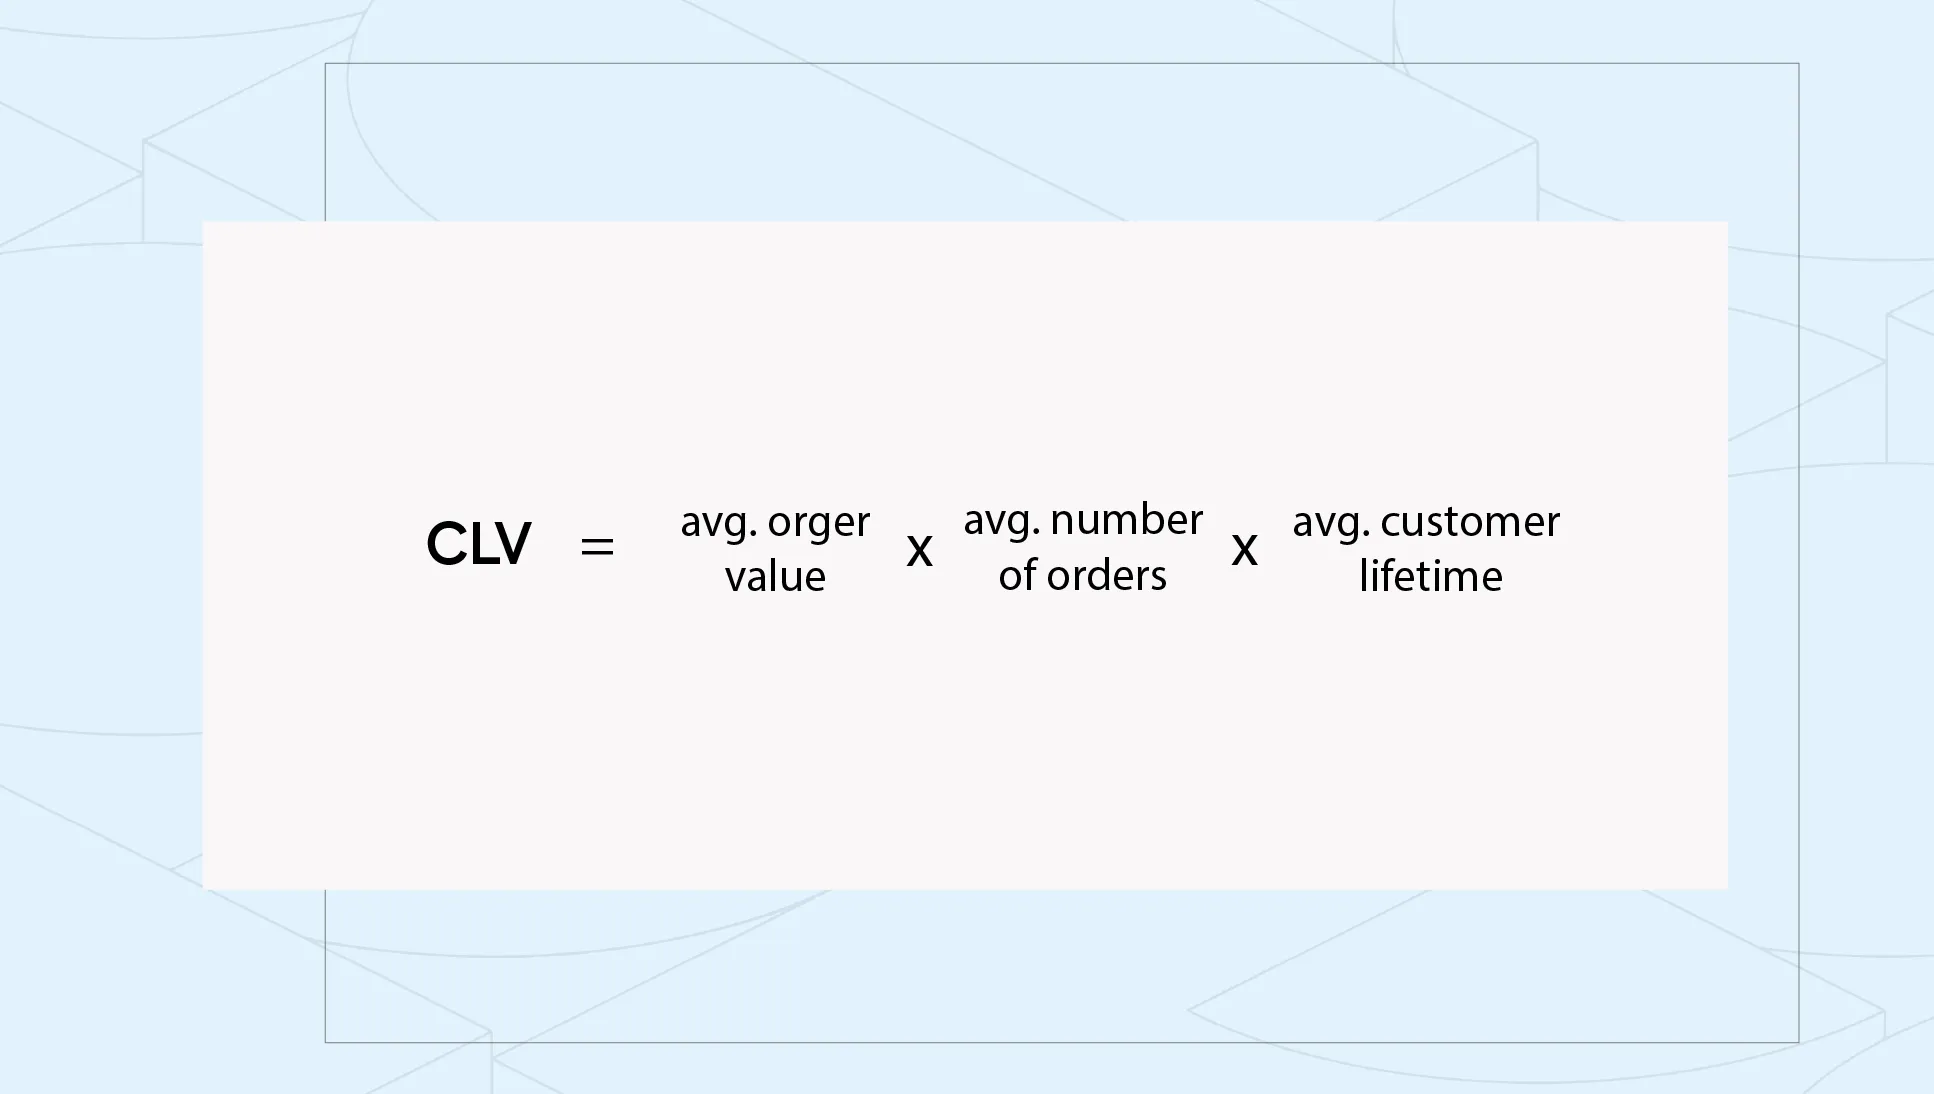
How to interpret the obtained results? The best way is to use an example - the CLV indicator of $100 means that this is the amount the buyer will spend during his entire relationship with the store. In addition, it also informs about the limit beyond which it becomes unprofitable to acquire a single customer (in the cited example, it is $100). An increase in the CLV ratio means that customer loyalty improves or customers decide to make higher-value purchases. Then the company can allocate more resources to acquire new users. How to improve the coefficient value?
- analyze marketing activities such as push notifications, email marketing, advertising campaigns, which will allow you to assess which tools have a positive impact on maintaining customer lifetime, and which are worth abandoning,
- introduce additional discounts for long-term customers to build loyalty,
- use additional promotion channels, e.g. social media, to maintain an ongoing relationship with the clients, as well as strengthen the brand image.
3. Customer Acquisition Cost (CAC)
The beginning of the path to purchase begins in various ways - shoppers find an online store through a search engine, are directed to it through paid campaigns or simply visit the platform through the recommendation of others. It can be difficult to calculate the average cost of customer acquisition with such diverse routes of arrival. For this reason, it is worthwhile to analyze this rate separately for each customer acquisition channel, which will allow you to examine which one is the most effective. Depending on the specific activities undertaken by the company, there are several ways to calculate this value.
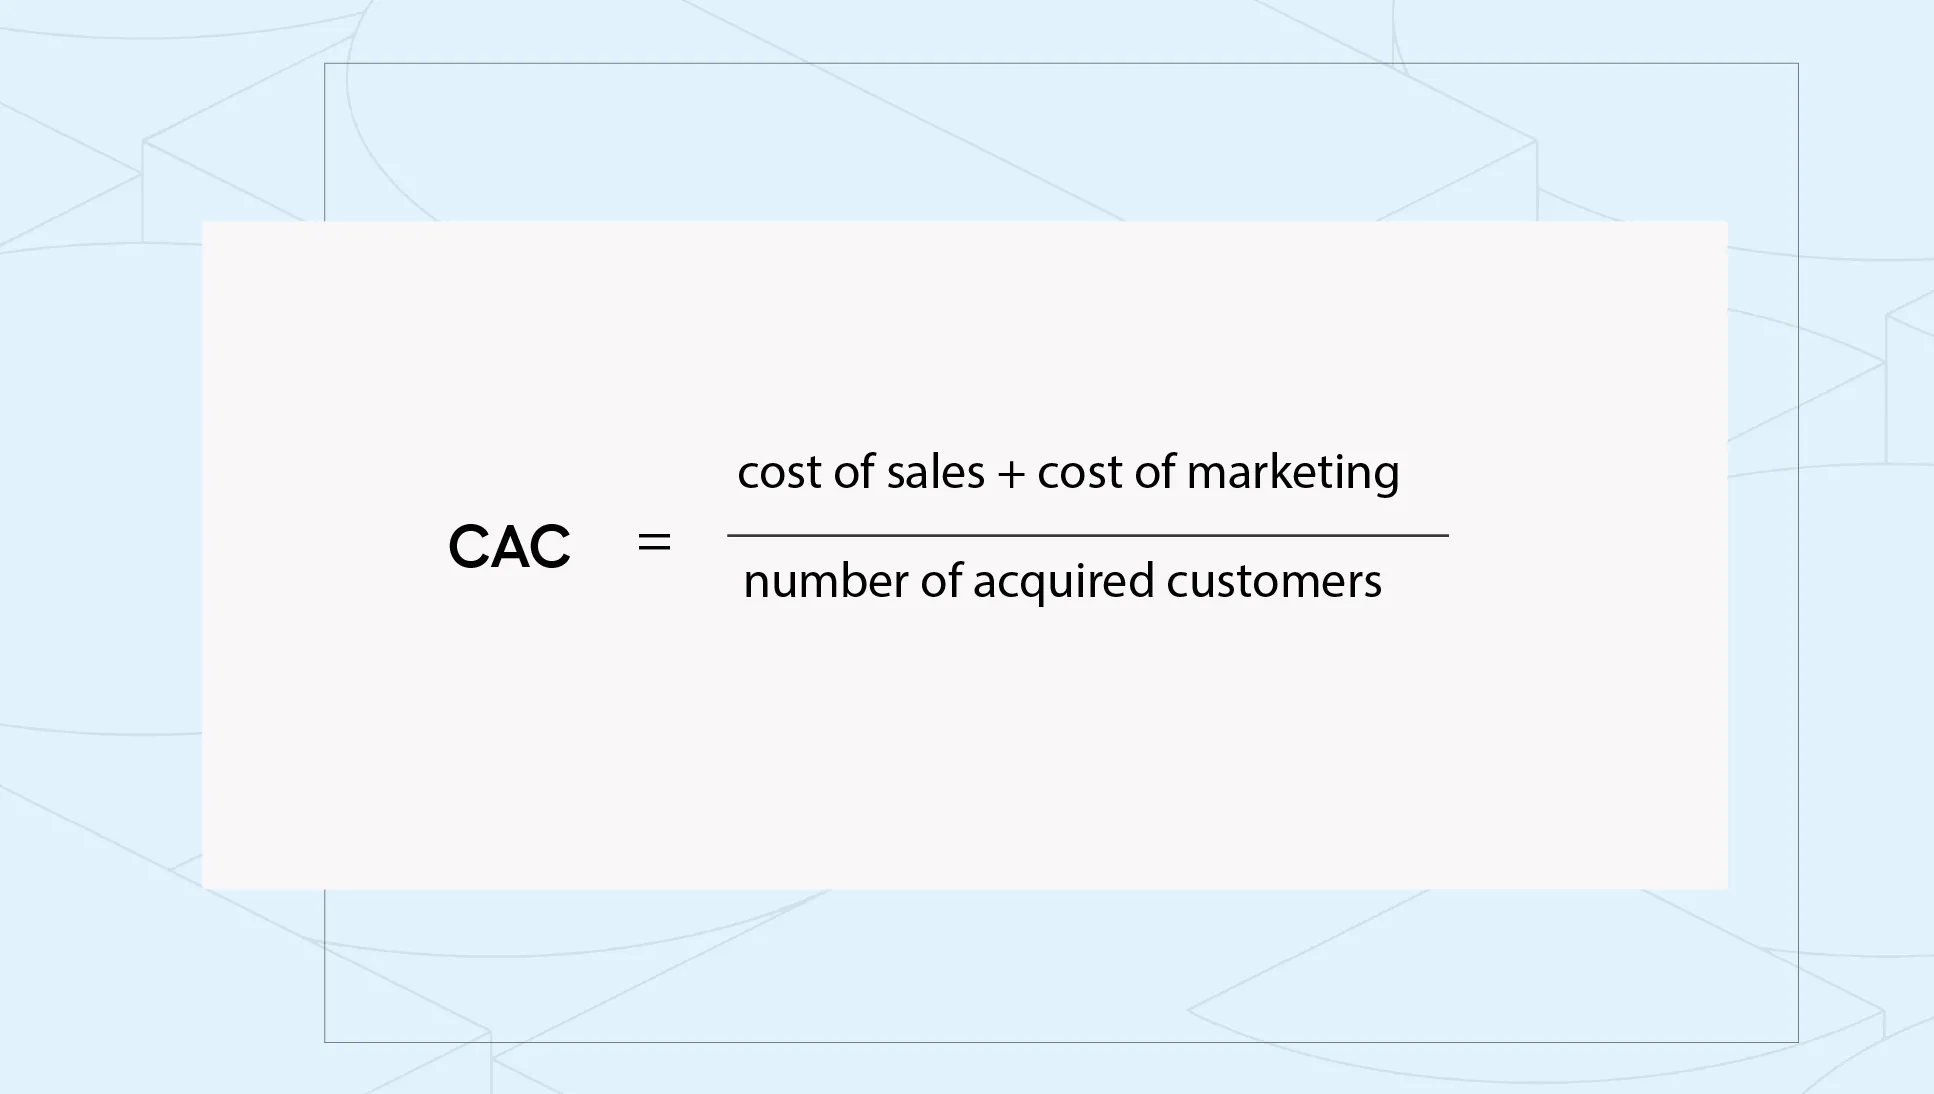
In opposition to the previously discussed rates, the goal of eCommerce managers is to reduce CAC (Customer Acquisition Cost). After all, everyone cares about constantly optimizing costs and improving the efficiency of outreach channels. A higher CAC value means that it becomes more expensive to acquire new customers. How to avoid this risk?
When correctly assessing the rate, it is important to correctly and fully identify costs. Underestimation or skipping any of the elements may involve drawing wrong conclusions - do not forget such values as:
- costs of preparing advertising materials,
- costs of employees,
- costs of paid tools,
- sales support costs, including commissions for salespeople.
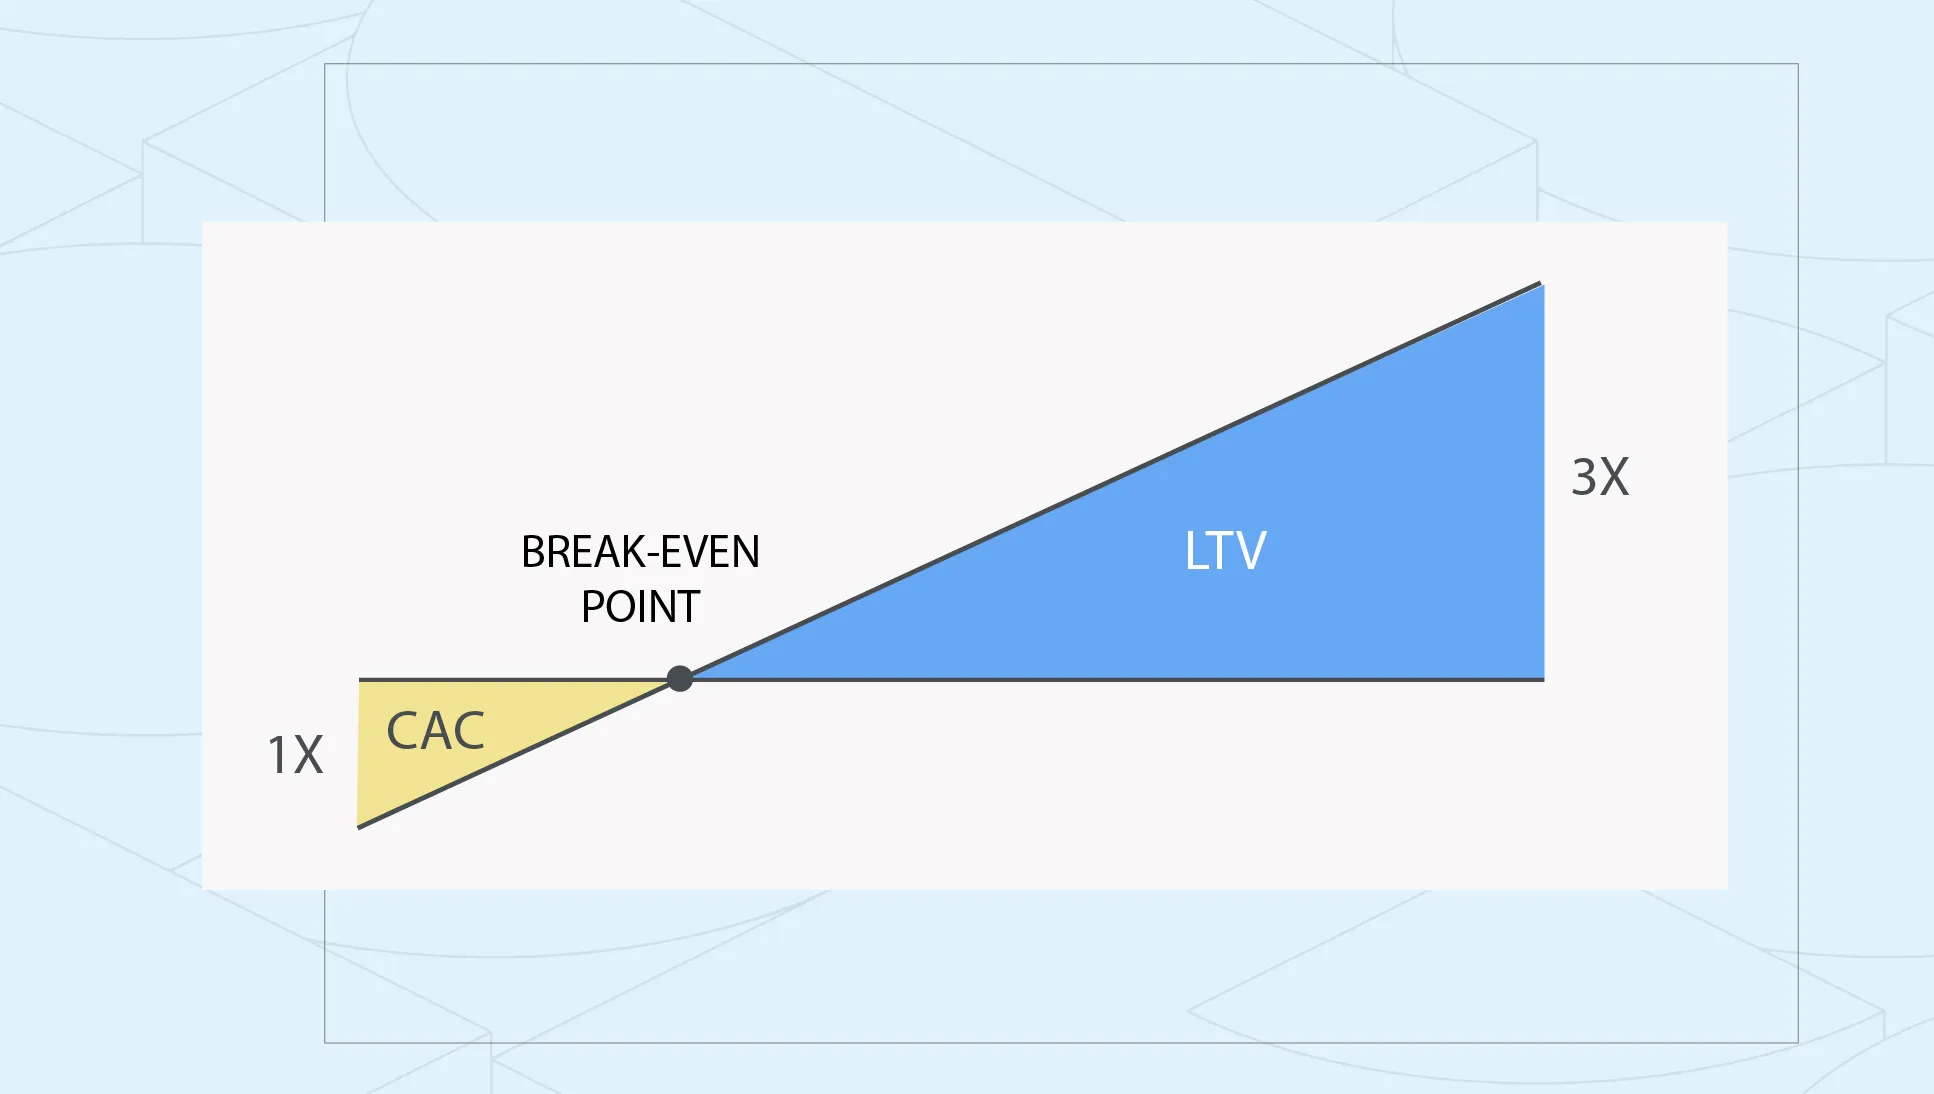
CAC is also worth comparing with the Customer Life Value discussed above. If the relationship between the two values is less than 1, it means that the company is "subsidizing" each customer acquired, and the expenses incurred are not reimbursed. The optimal result, on the other hand, is to reach 3 times LTV/CAC, which means that the cost of customer retention and acquisition promotes profitability of operations.
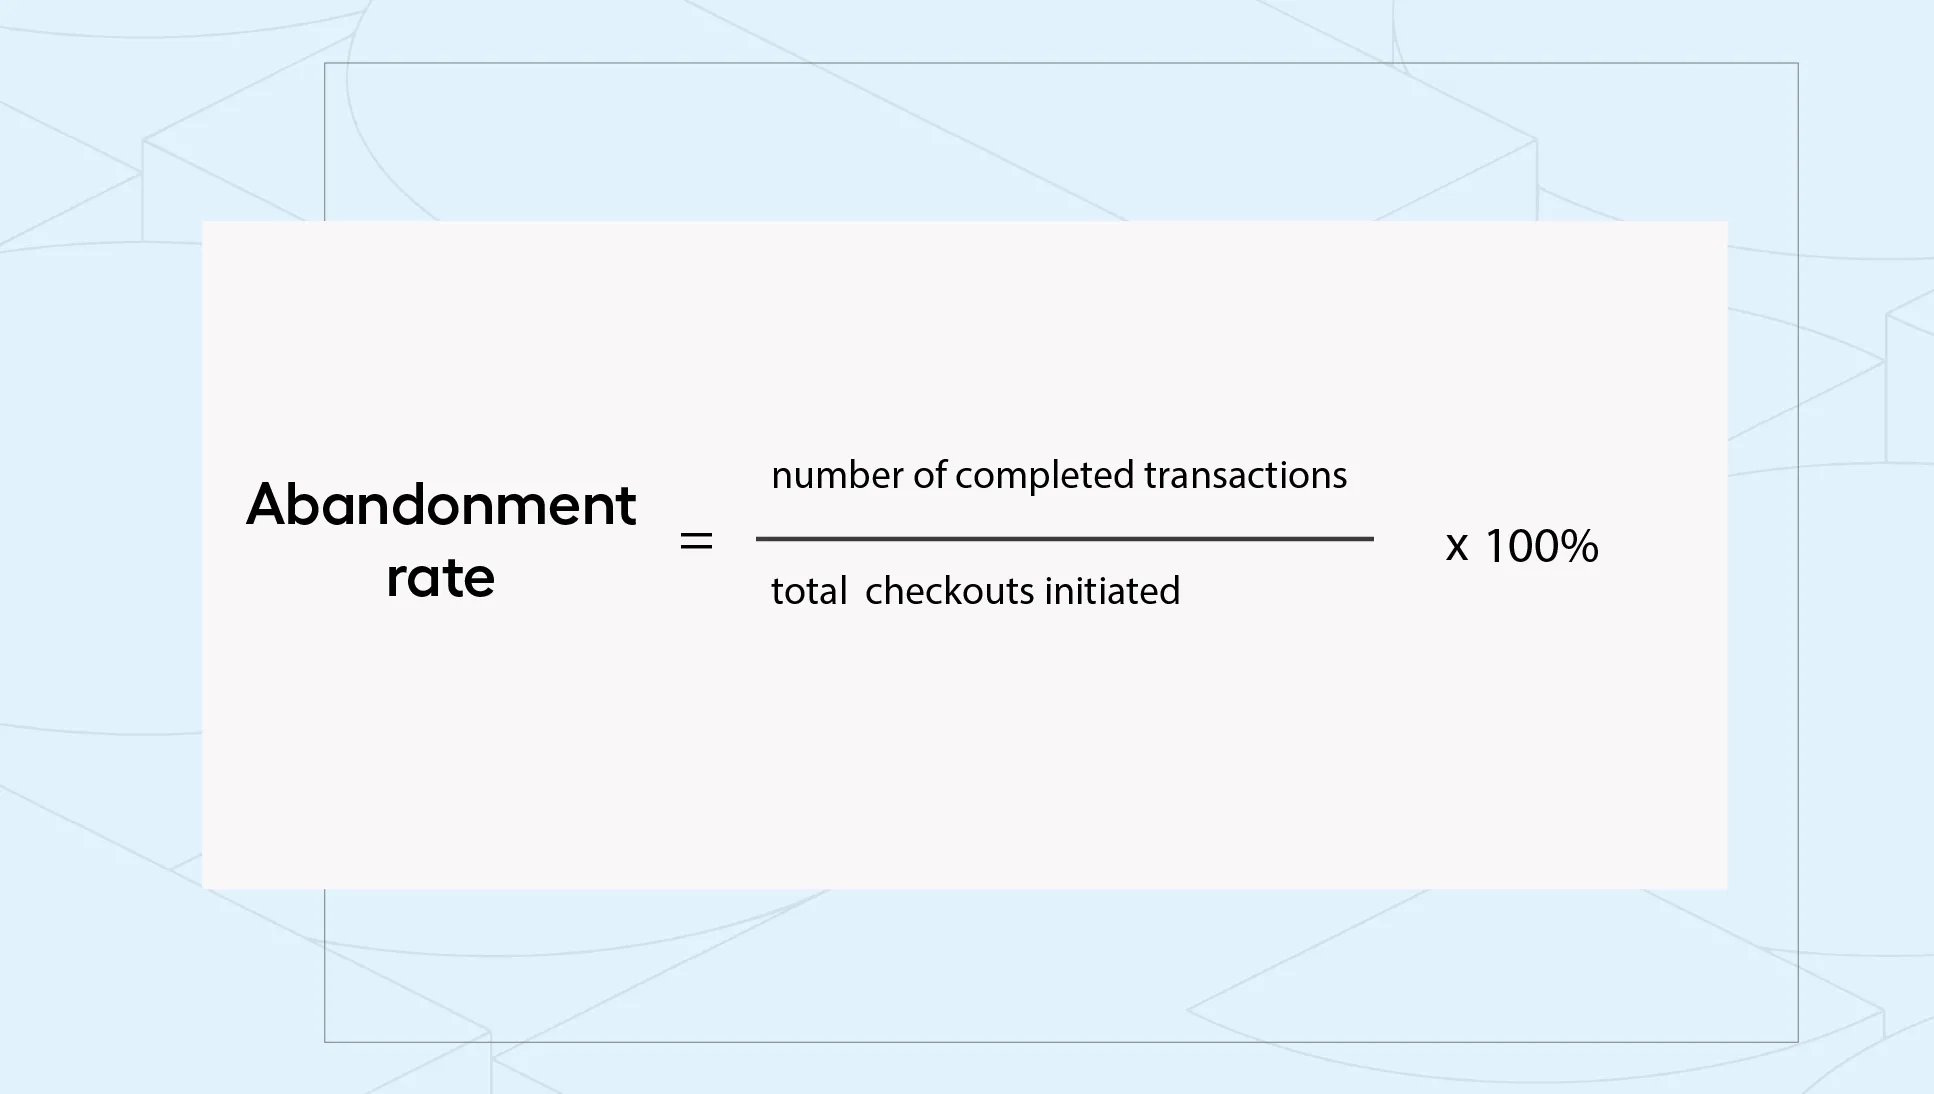
4. Cart abandonment rate
According to Dynamic Yeild's observations, 69% of eCommerce users do not make a purchase, despite starting the order process on the online store. When shopping on mobile devices - as many as 85% abandon the transaction. How to calculate the shopping cart abandonment rate for your online store?
The catalog of reasons for abandoning a purchase at any stage is extensive. Customers find a better deal, have all sorts of problems during the purchase, or simply get distracted. So the first step to increasing the ratio is to find the reason for abandoning the transaction. It is worth looking at the platform's technical solutions and tracing the path of the users' visit to the store, which will help identify the moment of cart abandonment. This process will be facilitated by using tools such as Hotjar or Clarity. Ordering a professional UX audit is also helpful in detecting errors. What kinds of mistakes can lead to unfinished transactions? The Chamber of Digital Economy, in its report "Porzucony e-koszyk. Dlaczego konsumenci porzucają zakupy w Internecie?" outlines the most common reasons for shopping abandonment:
- no option for shopping without registration,
- insufficiently extensive list of payment or delivery methods,
- overly elaborate ordering form,
- unclear return policy,
- shopping cart that does not include the option to save products.
The rate of abandoned shopping carts focuses on the final stage of the transaction. Therefore, attention to a positive shopping experience at this very moment is particularly important to minimize consumer abandonment. However, it should be remembered that, as in previous cases, an exemplary value for the indicator does not exist - depending on the individual characteristics of the business, the optimal result may vary.
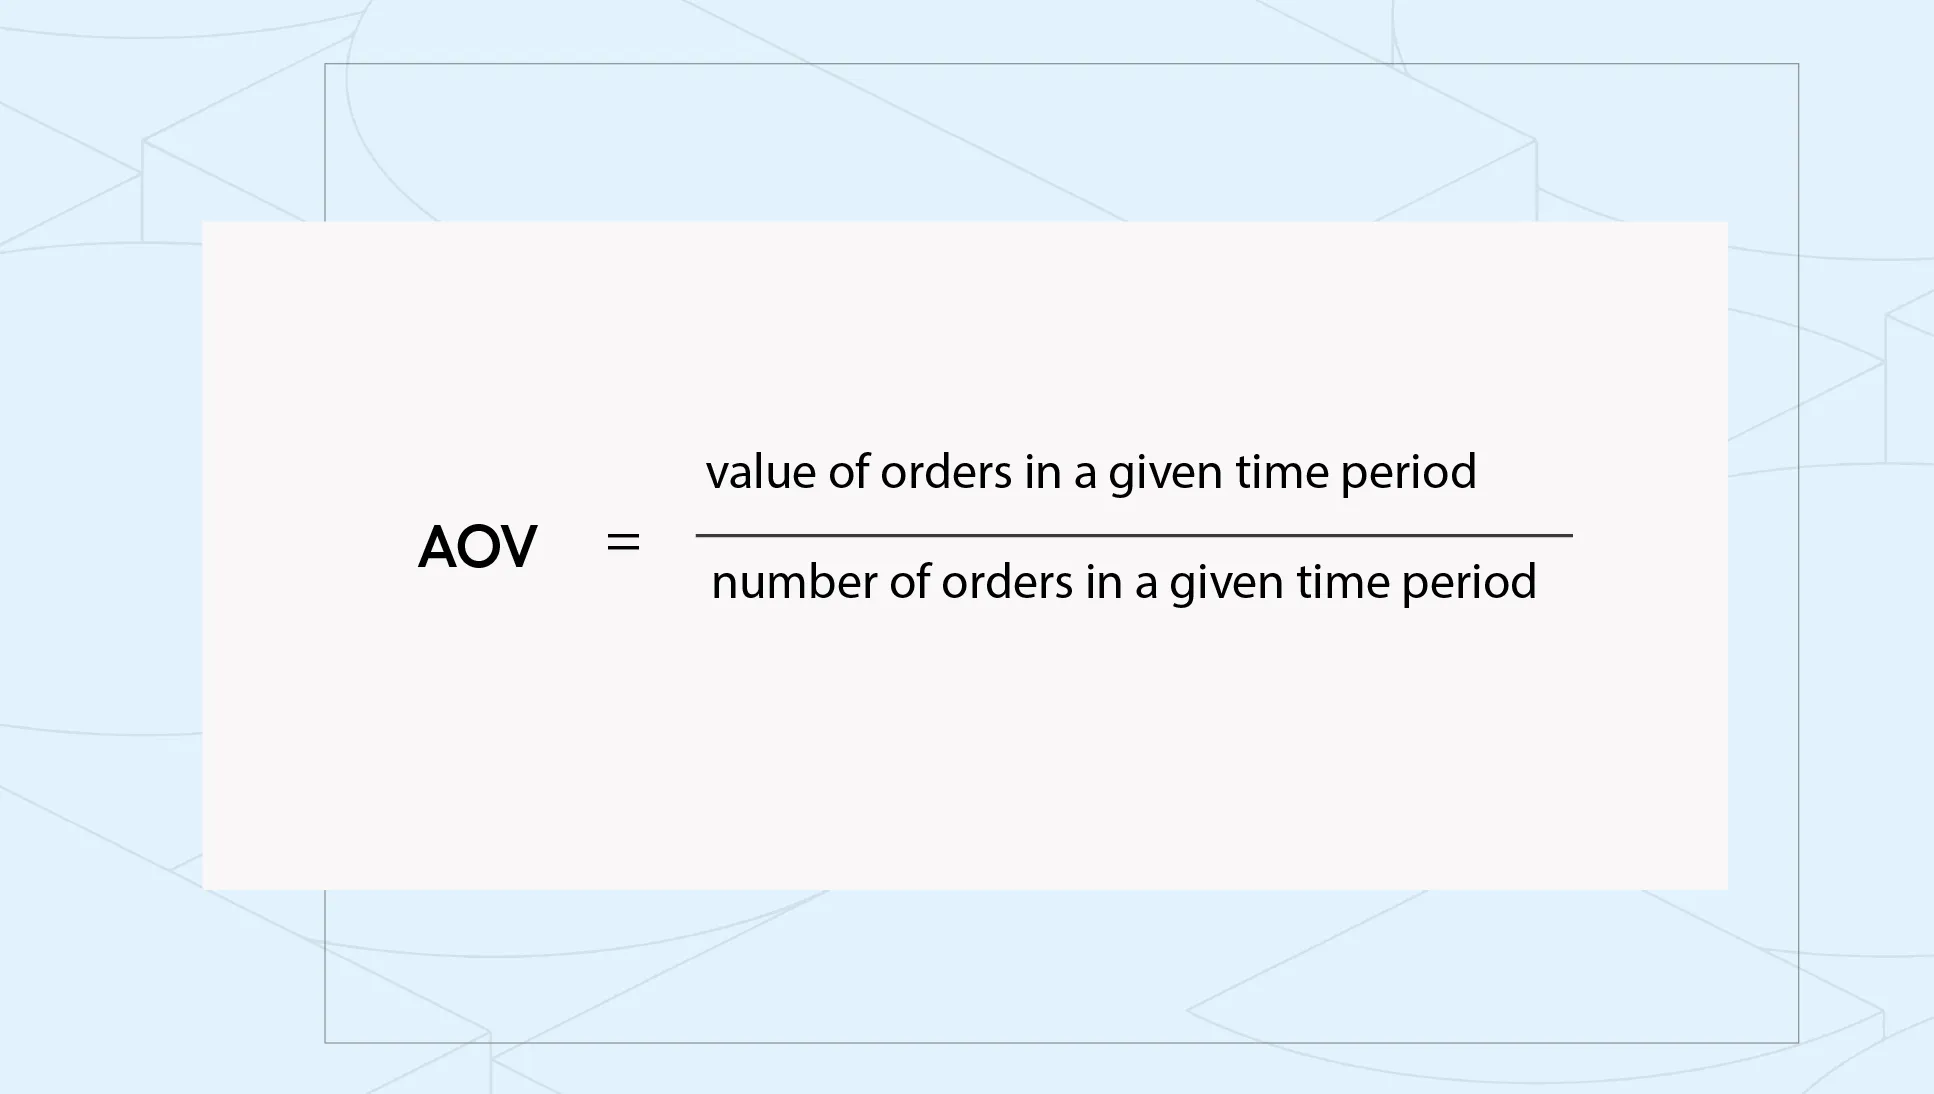
5. Average Order Value (AOV)
Customers buy more and the store generates more profits - this is one of the primary goals for eCommerce owners. How to encourage customers to increase the value of the shopping cart? An analysis of the Average Order Value (AOV) rate will help in selecting the right business actions and tools.
Monitoring average order value allows you to deepen your knowledge of consumers' buying habits and measure their propensity to increase their spending. What actions can improve sales effectiveness?
- Upselling - offering the customer an improved version of the product they are currently interested in,
- Crosseling - offering complementary services and products (e.g. additional assurance with the computer purchase),
- Introducing loyalty programs.
eCommerce owners also frequently modify the free delivery threshold in order to increase the value of the shopping cart. Experts advise setting it at about 30% higher than the AOV - a customer will most likely be willing to exceed the value of their typical order to qualify for free shipping.
Use the collected data - prepare your eCommerce for the future
Monitoring data is crucial in evaluating your operations. Sometimes it may turn out that increased efforts in some area do not bring you closer to your goals at all. Calculating key indicators will certainly be helpful in achieving your plans. However, just collecting the results is only halfway - it is their interpretation and proper collation that allows you to draw conclusions, eliminate problems and provide opportunities for faster development of your e-business. You already know the tools - are you ready to implement them in your online store?
In this article you've learned about 5 basic indicators, which provide an introduction to a series on data analysis in eCommerce. Want to explore the performance of your own sales platform in even more depth? Keep an eye on our blog for updates!