If the rates won't change the way you run your business, they aren't worth monitoring - this statement illustrates that keeping eCommerce statistics is pointless when it doesn't involve taking any action to improve performance. Analyzing your eCommerce store's data should always aim at a specific goal (such as detecting errors in your current strategy or business development in the future). Guided by this thought, in the first edition of this series, we presented 5 basic indicators. Get to know more of them now and see how your eCommerce business can benefit from their analysis.
1. Returns ratio
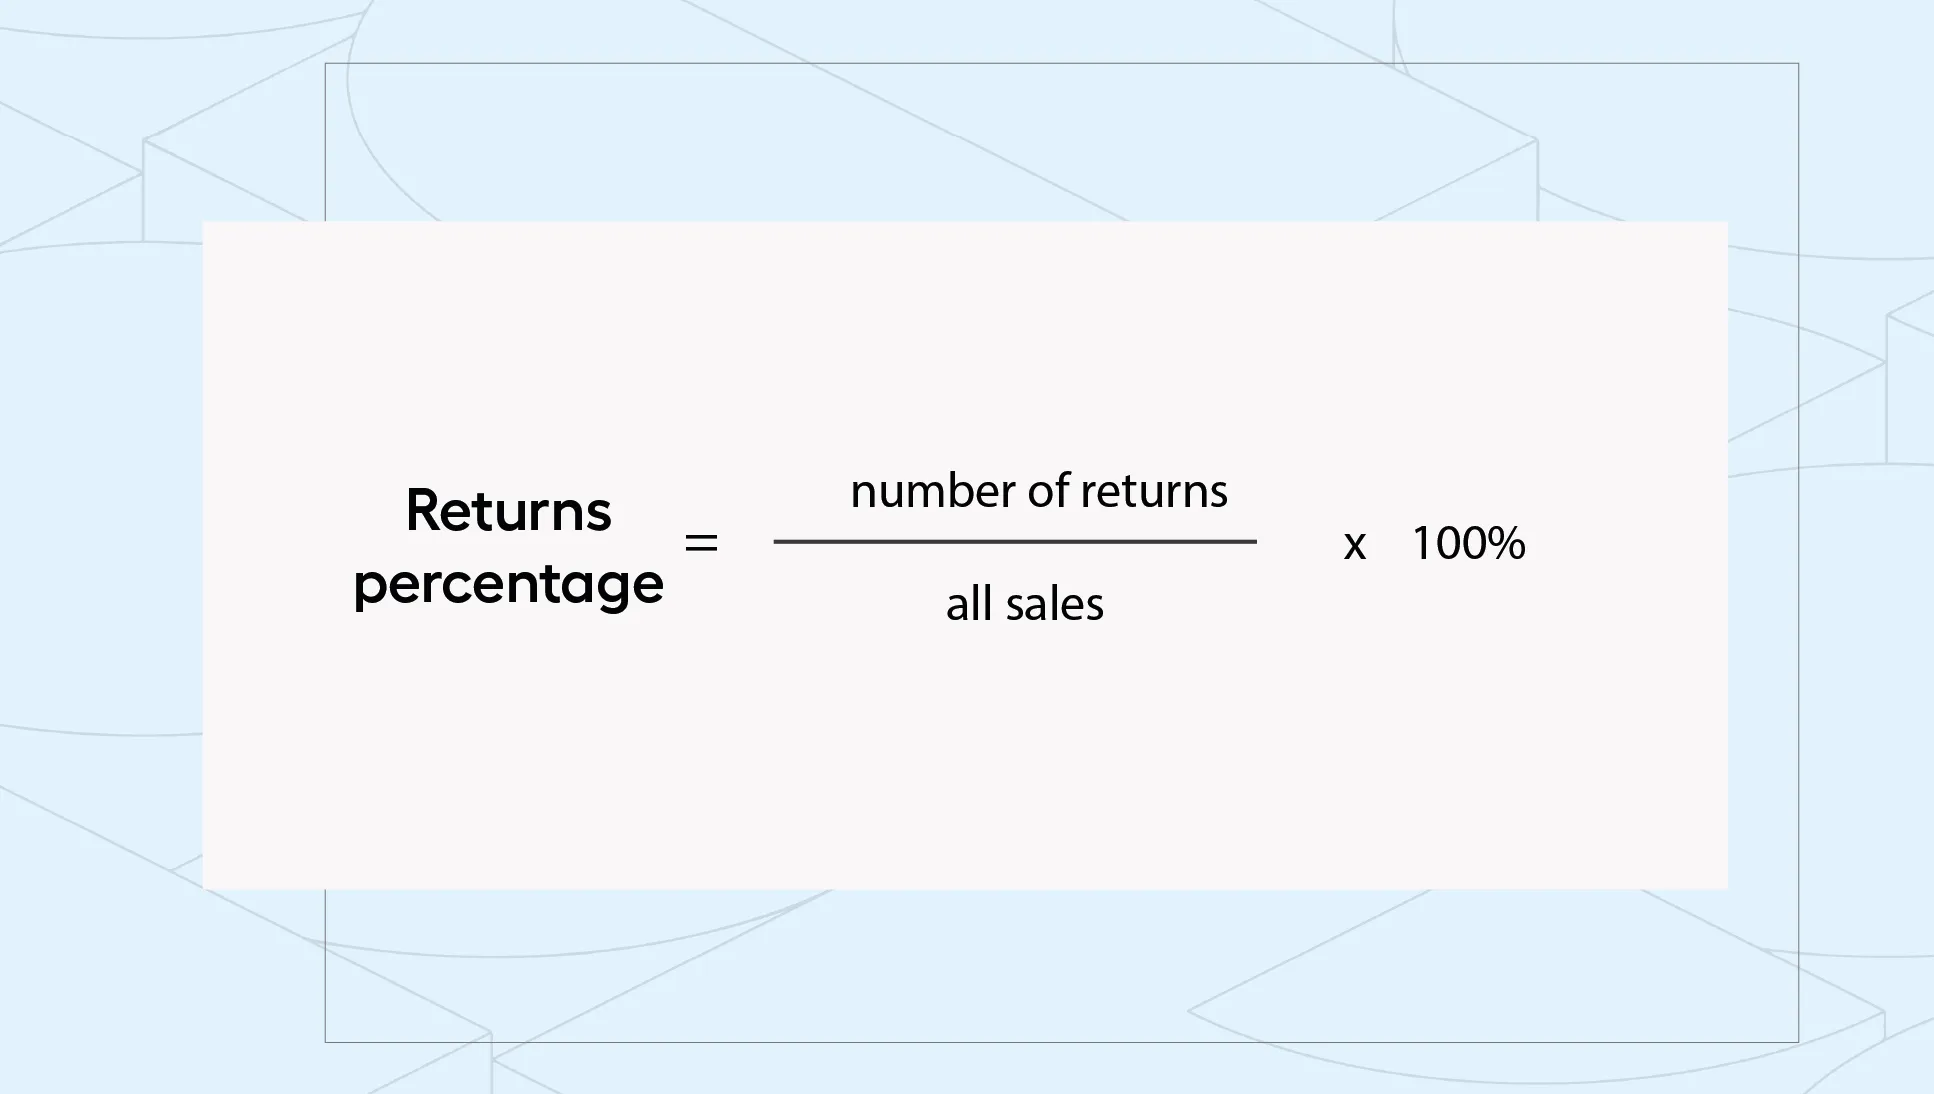
Returns are an unavoidable part of eCommerce - buying remotely always involves the risk that the ordered product will not meet expectations. Nevertheless, when analyzing the performance of an online store, it is also worth taking into account the returns rate. Its increasing value may indicate the need for changes in the functioning of the sales platform, especially in the way the product range is presented.
According to a Santander Consumer Bank study, the vast majority of consumers return products due to incorrect measurements or inconsistencies with the product description. That's why it's a good idea to first make sure that product descriptions contain all the necessary information on relevant parameters (e.g. size, material, composition). Equally important are properly selected photos, showing the product from several perspectives. It is also increasingly common practice to use modern solutions such as 360° presentations or the use of VR technology.
Not in every case an incorrect presentation of the product will determine the return - in order to know the real reason for the customer's actions, it is worth including a short question about the reason in the form. It may turn out that the buyer simply frowned, and the operation of the store leaves no complaints. In other cases, however, it is possible to influence the reduction of returns - how to achieve this?
- Placing a chatbot - a short conversation before making a purchase can clarify any doubts about a product. A chatbot will be great for this type of contact, which will not only guarantee a quick response, but also optimize the customer service process.
- Adding to the presentation of the product the opinions of other customers - according to the observations of the Office of Competition and Consumer Protection, 93% of consumers make purchasing decisions based on the ratings of others. Placing a section with reliable opinions (in accordance with the newly enacted Omnibus directive) will help the customer make a satisfactory decision.
- Control of logistics processes - there is a chance that a customer returns a shipment due to damage to the goods. Regular inspection of your own warehouses, as well as the quality of your logistics partner's services, is therefore essential to reduce this problem.
2. Mobile traffic study
The slogan "Mobile first" has become an integral part of the eCommerce industry - according to a report prepared by Gemius in 2022, as many as 75% of shoppers use a smartphone and 19% reach for a tablet when shopping online. What's more, users spend as much as 46% of their online shopping time browsing mobile apps.
Not only have mobile devices overtaken computers to become the most popular tool for browsing online stores, but it is also through them that potential customers are increasingly choosing to complete transactions. For this reason, it is worth tracking not only the frequency of mobile traffic itself, but also its quality. The use of publicly available tools such as Google Analytics will help. What should you pay particular attention to?
- Rejection rate - indicates what percentage of users abandon their stay on the site. If its value is higher for the mobile version, it may indicate problems in its functioning, such as lack of responsiveness or too long loading of the site.
- The number of visited subpages and the time spent on each of them - low values (compared to the computer version) in this regard can be affected by the mismatch of the store design to the specifics of a particular device. Due to the small size of the display, it is most important to guarantee comfortable and intuitive browsing. Additional widgets or complicated navigation (e.g., having to go through multiple tabs to find a particular piece of information or product) may discourage the user from taking action on the site.
- Cross-device purchase path - Google Analytics allows you to determine, based on the IP addresses collected, how many users are using more than one device during their purchase path. For example, a shopper may browse through an eCommerce site's offerings to find products of interest on a computer. On the other hand, he finalizes the order using his phone. In such a situation, it makes sense to focus on refining the mobile version of the checkout.
If you want the mobile version of the platform to function in parallel with its computer counterpart (and not just support it) you should focus on fine-tuning dedicated solutions for it. The elements that can positively affect the achievement of this goal are shown in the graphic below.
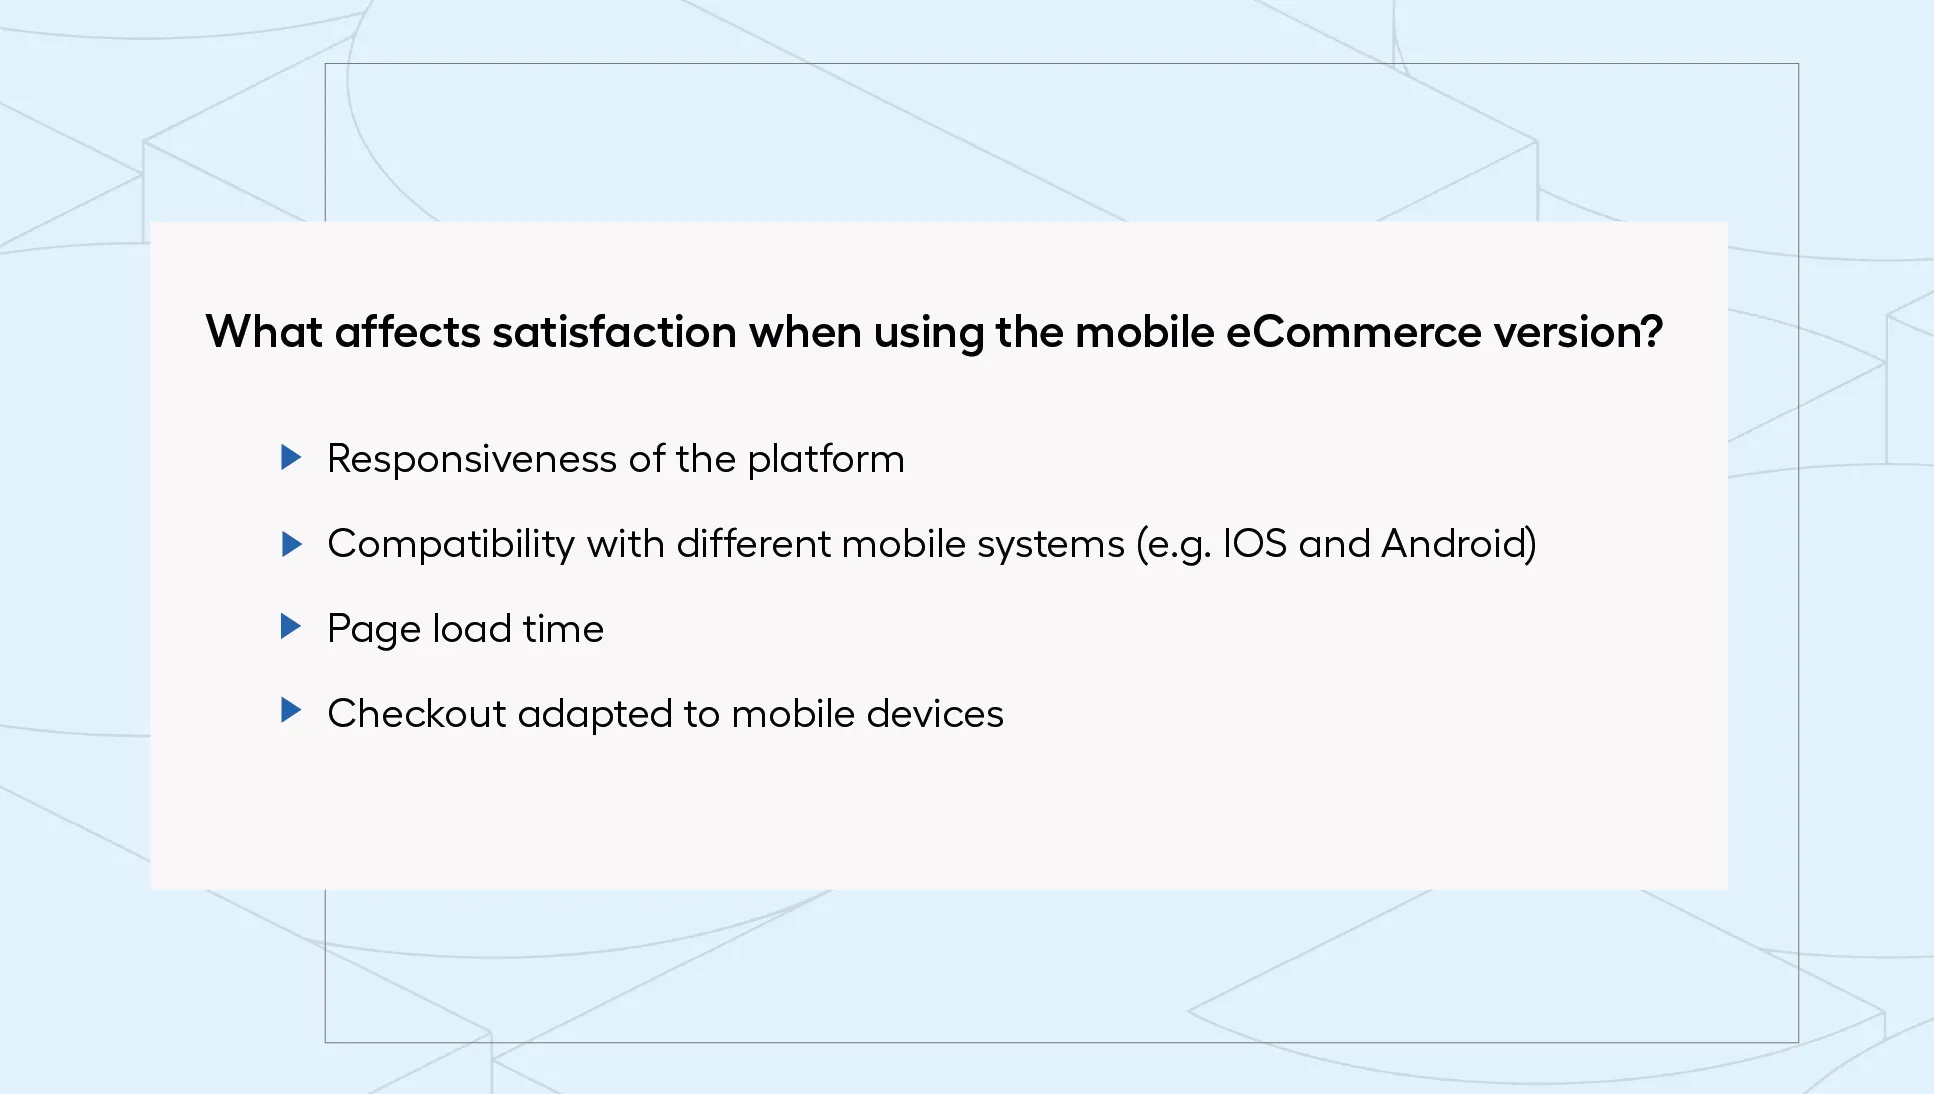
Market research confirms that mobile users generate more than half of online store revenues, and forecasts indicate that this is not just a temporary trend. It's worth running your e-business in a mobile-friendly spirit - such practices are also sure to prove friendly to its future growth.
3. Return On Ad Spend (ROAS)
It is now difficult to imagine building brand awareness in the eCommerce market without running effective online marketing campaigns. Website positioning, Google Ads or social media advertising - all of these activities require investment in the first place. How do you get control over the expenditures you are making to ensure that they are bringing in the targeted revenue?
An excellent tool for measuring the effectiveness of ongoing campaigns can be ROAS (Return On Ad Spend), which should be understood as the return on advertising expenditures. In the simplest terms, the result obtained allows you to determine the amount of revenue generated by each dollar spent on specific marketing activities. How to calculate and then correctly interpret the ratio?
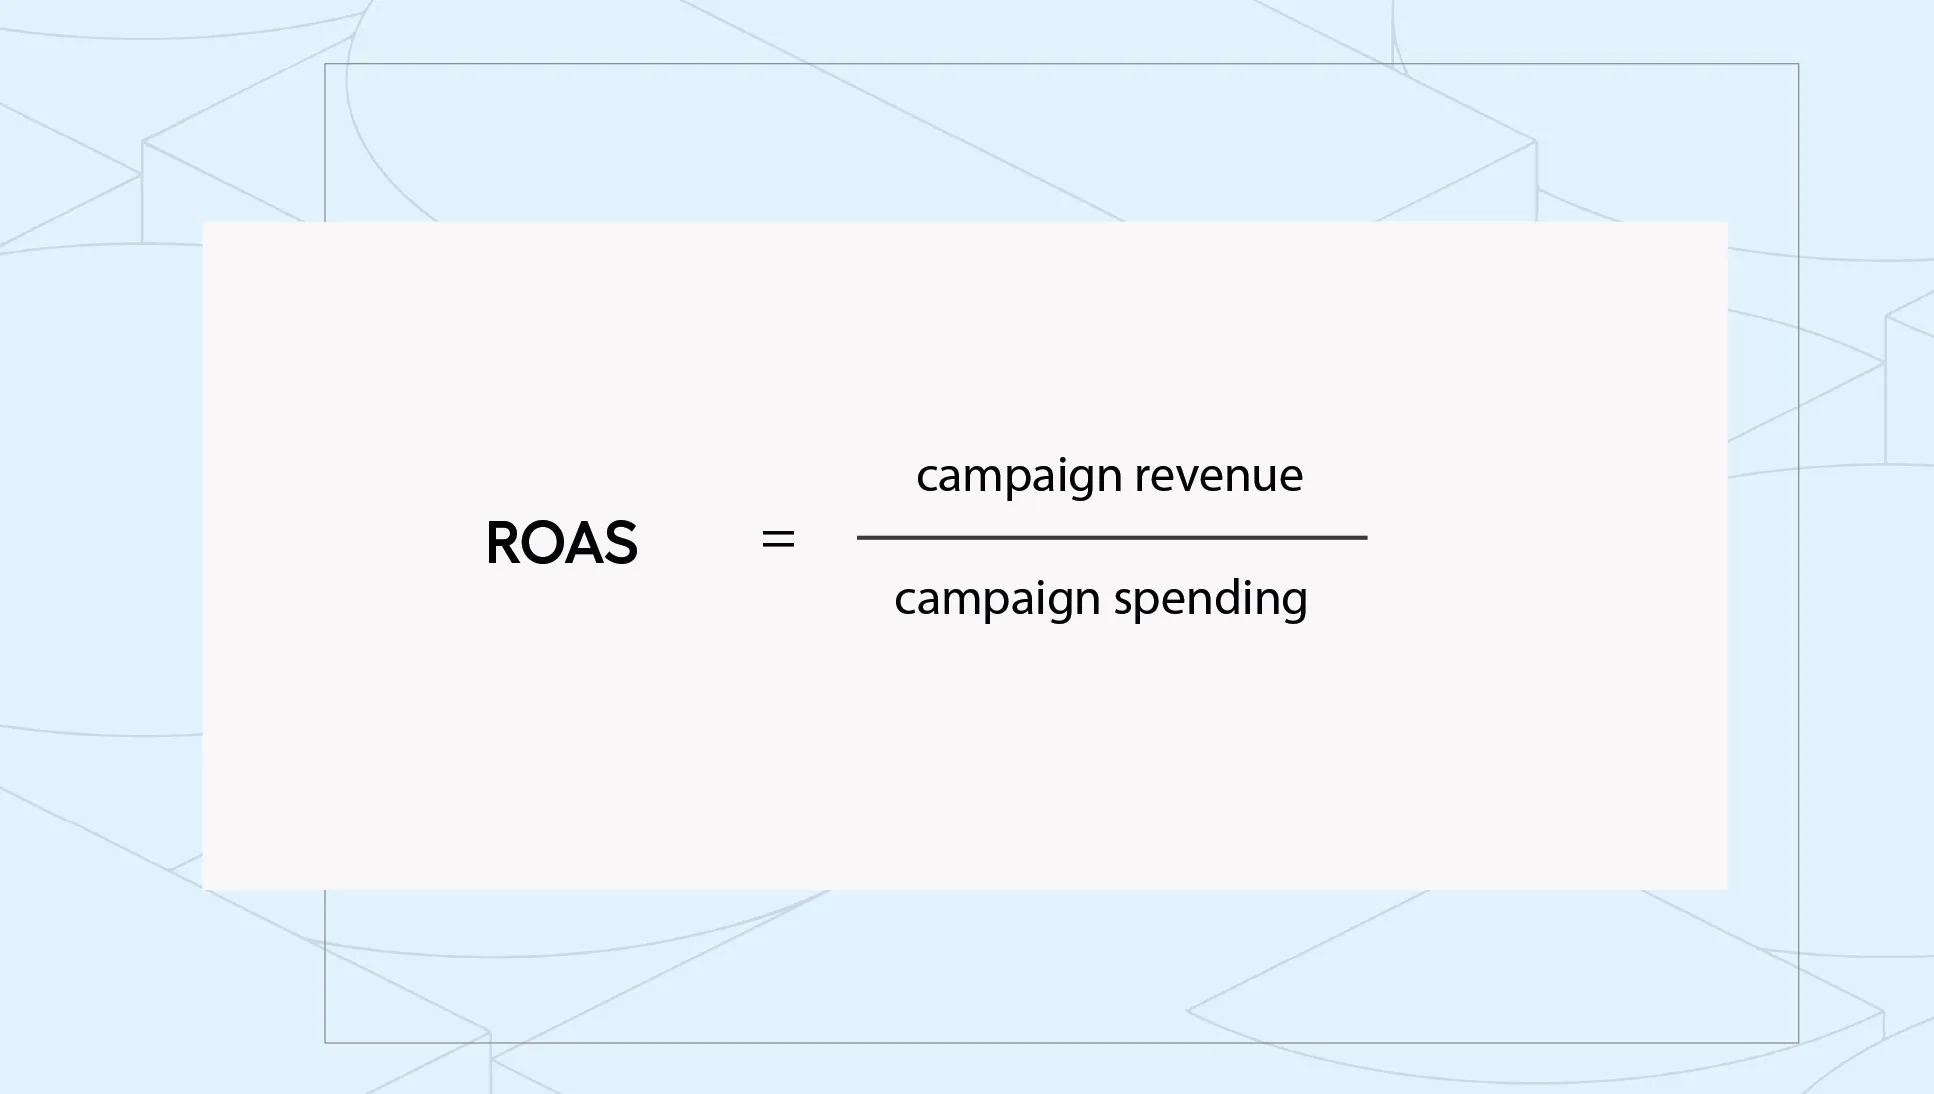
When preparing to process your own results, the first step is to carefully calculate the total cost of the campaign. Skipping a component can significantly curve the actual value of expenses. Often, when summarizing expenditures, one omits those most basic costs such as:
- salaries of those involved in the development of the campaign,
- expenses related to the use of equipment, specific tools or applications,
- other services such as the salary of an outsourced graphic designer.
The data collected, the indicator calculated, then the question remains - what value should a satisfactory ROAS achieve? The return on advertising expenditures should exceed 0. However, the optimal results vary depending on the industry, the amount of margin or simply the scope of the campaign. The differences can be seen in the average ROAS, where for individual advertising platforms the values can differ a couple of times. However, it should be remembered that Return On Ad Spend only indicates the revenue associated with the expenditures made on advertising campaigns. How do you measure whether other capital expenditures are yielding the assumed returns?
4. Return On Investment (ROI)
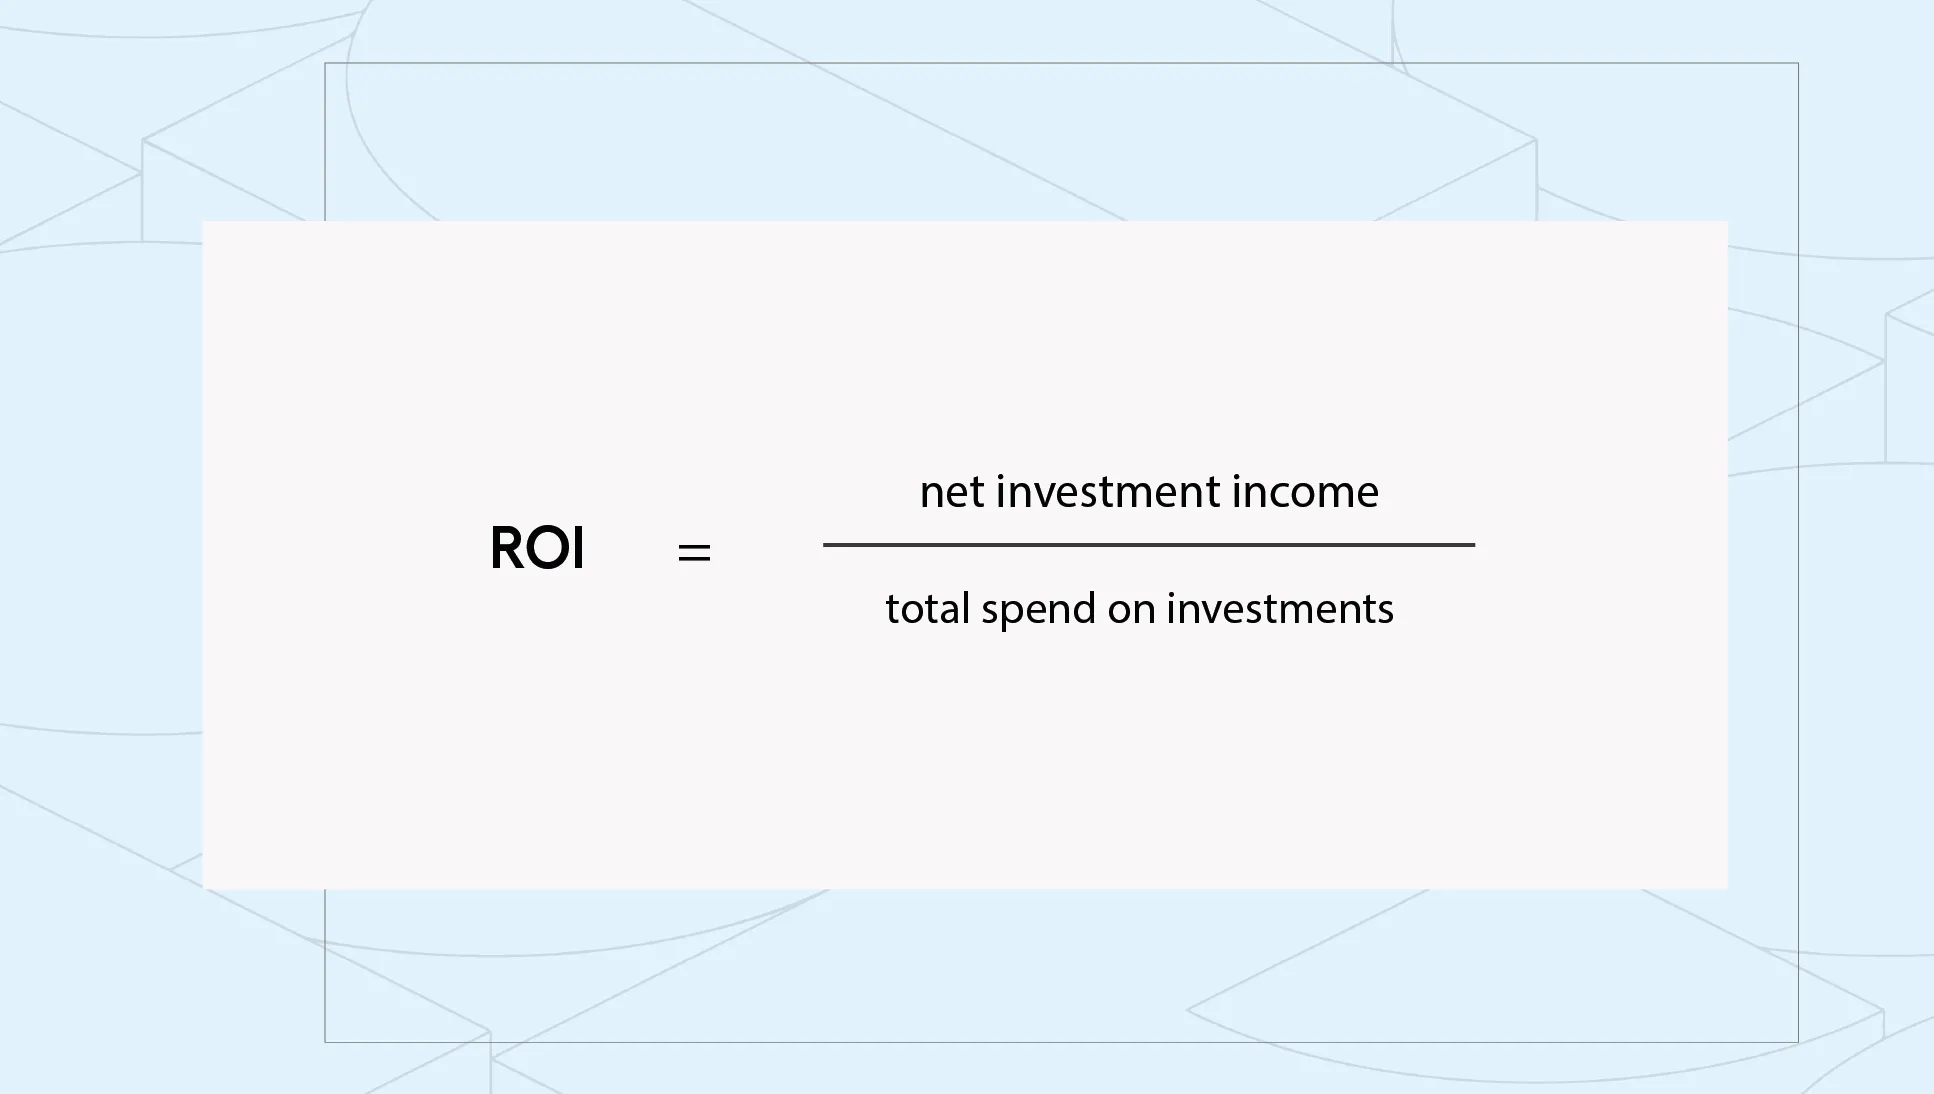
You already know how much revenue is generated by advertising campaigns - this result does not allow, however, to determine the effectiveness of other investments. To obtain such information, you will use the ROI (Return On Investment) ratio. How to calculate it? Just modify the formula for ROAS, replacing campaign revenue with net profit on investment.
As in the previous case, if the indicator reaches a value greater than 0, it means that the investment started (such as the purchase of better equipment or the implementation of new software) is effective, and therefore translates into profit for eCommerce. The amount of the indicator will again vary depending on individual factors - for this reason, it is worth comparing the ROI of specific investments and their location over time, and on this basis develop those with the highest performance. Often there is a high probability that, due to above-average implementation costs, the initial ROI will reach lower values than in subsequent stages of investment, when expenses stabilize.
To calculate ROAS and ROI, similar data are used, but their results indicate the effectiveness of other areas of the company's operations. For a complete and correct picture of the investments made and profits achieved, it is worth monitoring both values. Such action allows you to take a broader perspective on the strategies carried out, and thus better plan budgets, eliminate unnecessary costs and focus on the most profitable solutions.
5. Net Promoter Score (NPS)
Nowadays, access to information does not require too much effort. Brand reviews, product reviews and the overall experience of the buying process influence the consumer's decisions and his relationship with the company in the future. According to research conducted by OXIDE.PL, the cost of acquiring a new customer is 5 to 7 times higher than the expenses incurred in maintaining loyalty. Is it possible to capture in a measurable way the level of customer loyalty to an e-store in order to study the effectiveness of activities in this area?
Measuring customer loyalty is possible by using the Net Promoter Score (NPS). The measure indicates the ratio of customers who declare their willingness to recommend the e-store to their friends to those who are not satisfied with the performance of the platform (e.g. due to errors encountered in the operation of the site). The calculation ignores the opinions of indifferent people, as they neither strengthen nor weaken the strength of the brand. Obtaining this data requires an additional action, i.e. conducting a survey. A properly formulated form should include a question on the evaluation of satisfaction with purchases on a scale of 1 to 10. A survey constructed in this way allows you to divide customers into 3 groups, the so-called...:
- brand detractors - people who selected a response from 1 to 6,
- brand promoters - people who rated their satisfaction at 9 and 10,
- indifferent customers - people whose response (7 and 8) indicates that their experience was neutral.
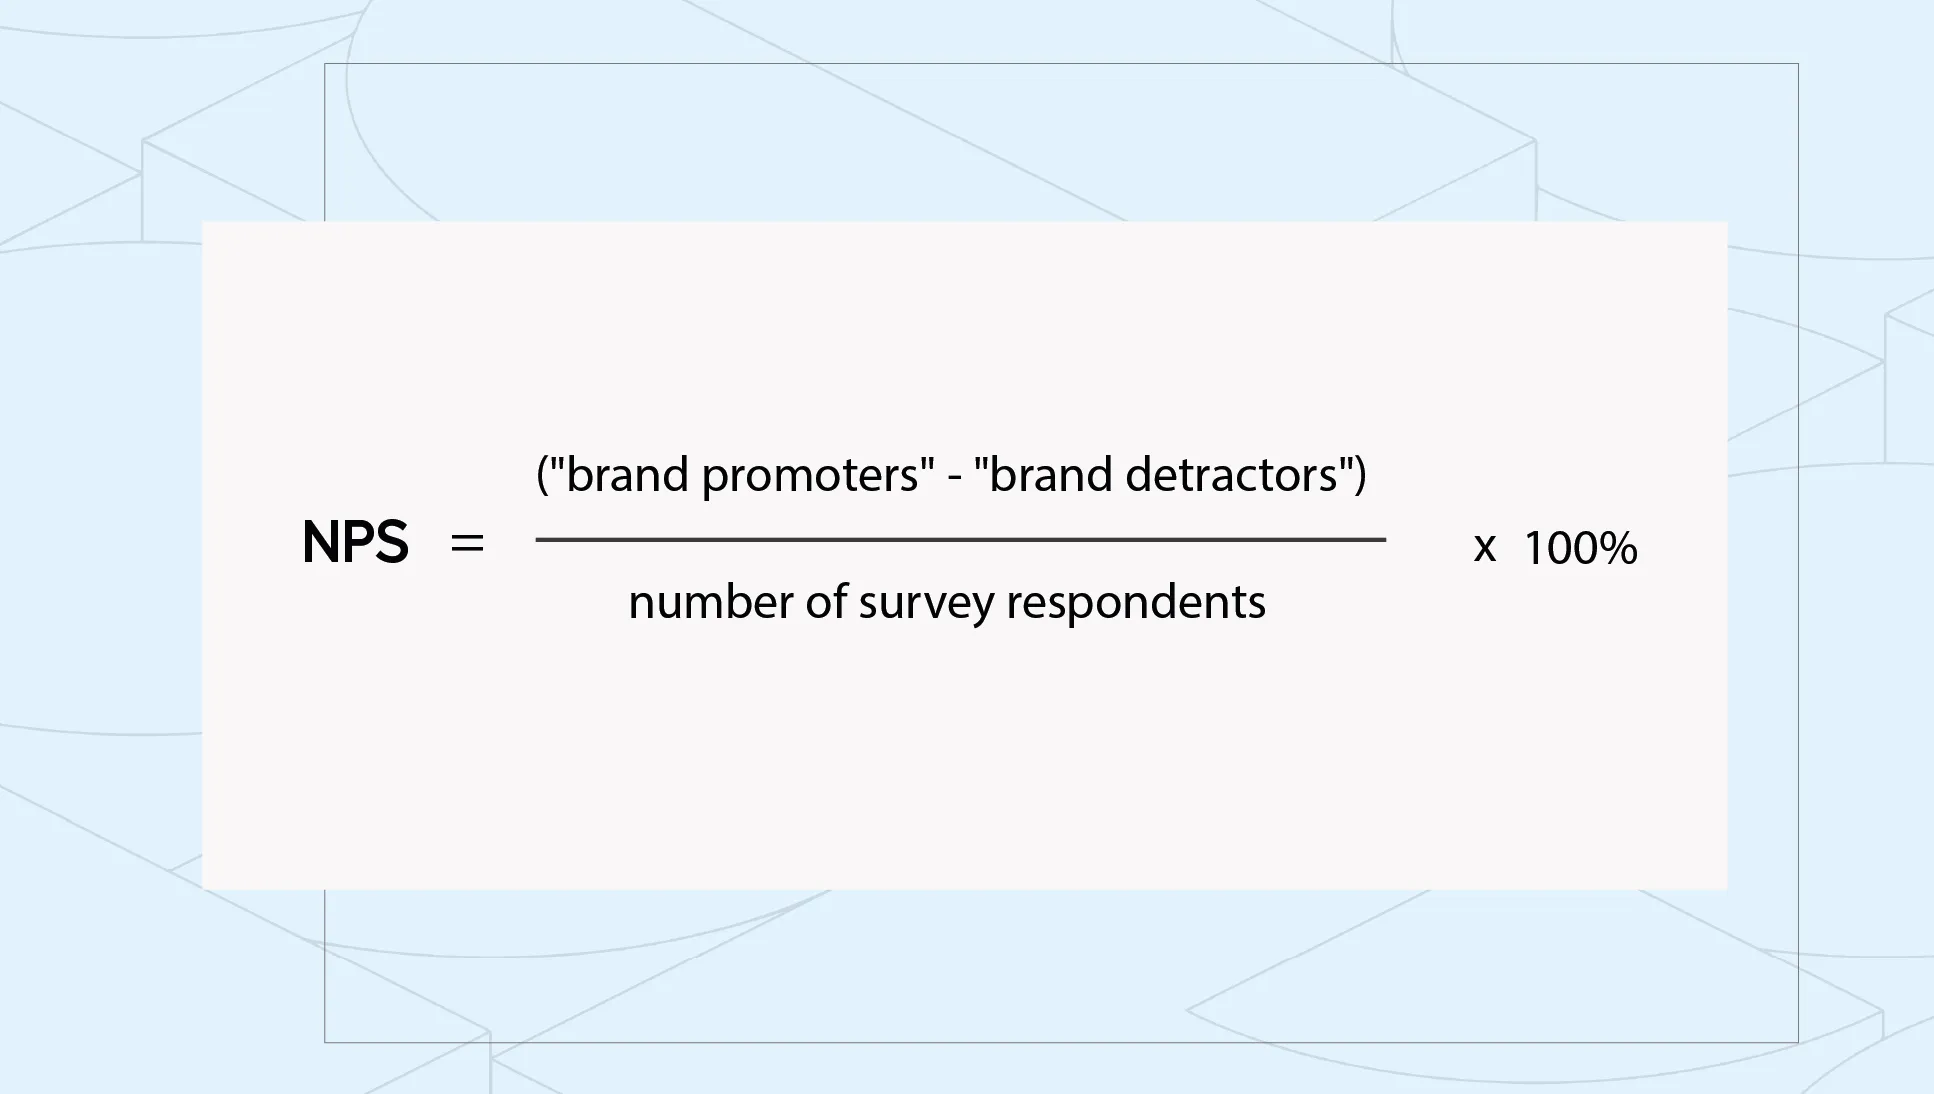
The values of the indicator range between -100% and 100%. A positive NPS allows one to conclude that the experience of most customers was positive. On the other hand, an index below 0 indicates that there is an overwhelming group of buyers who are not fully satisfied with their purchases. This means that they are unlikely to repeat the transaction. In order to identify areas that need improvement (or further development in the case of positive feedback), it is worth enriching the survey with a question about why a certain rating was given.
By using the NPS indicator, it is possible to maintain long-term trust, which not only influences a higher level of customer service, but also makes it possible to predict the level of future sales. Thus, a trusted customer base affects eCommerce profitability, and the Net Promoter Score is not only a simple, but also an authoritative tool, the ongoing monitoring of which will help improve both results. Keep in mind, however, that NPS is based on survey data, and collecting it requires additional customer involvement, which is often met with reluctance.
Indicators make sense - use them well
You already know the 10 basic indicators that can improve your eCommerce performance. Their selection depends on the needs of your online store. Increase the level of sales, boost the effectiveness of marketing campaigns or improve customer loyalty - whatever your goal, the indicators will determine the direction you should take your future activities. Monitor your business on a regular basis and ensure stable conditions for development!